Fig. 1
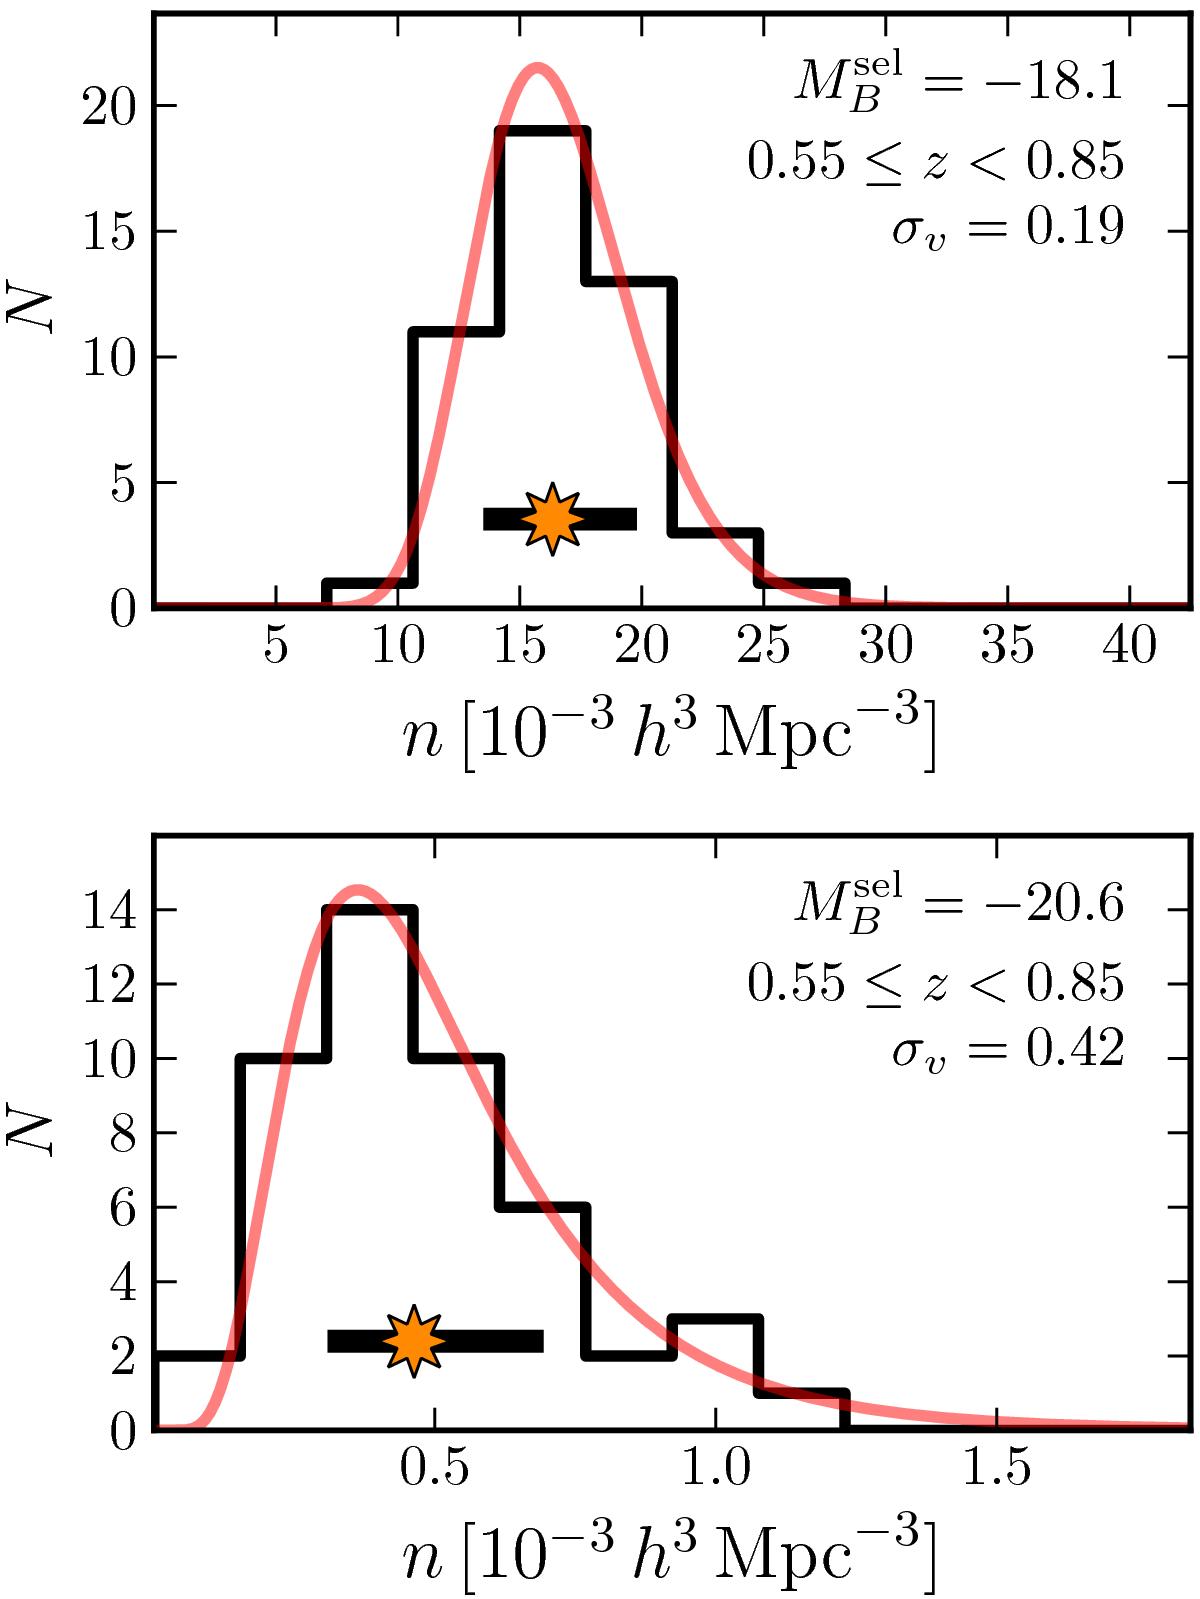
Number density distribution of ![]() (top panel) and
(top panel) and ![]() (bottom panel) galaxies at 0.55 ≤ z< 0.85 from the 48 ALHAMBRA subfields. The star and the black bar mark the median and the intrinsic dispersion retrieved by the MLE, respectively. The red solid line shows the best MLE solution convolved with the observational errors and it is independent of the histogram binning. The derived relative cosmic variance σv is labelled in the panels. A colour version of this plot is available in the electronic edition.
(bottom panel) galaxies at 0.55 ≤ z< 0.85 from the 48 ALHAMBRA subfields. The star and the black bar mark the median and the intrinsic dispersion retrieved by the MLE, respectively. The red solid line shows the best MLE solution convolved with the observational errors and it is independent of the histogram binning. The derived relative cosmic variance σv is labelled in the panels. A colour version of this plot is available in the electronic edition.
Current usage metrics show cumulative count of Article Views (full-text article views including HTML views, PDF and ePub downloads, according to the available data) and Abstracts Views on Vision4Press platform.
Data correspond to usage on the plateform after 2015. The current usage metrics is available 48-96 hours after online publication and is updated daily on week days.
Initial download of the metrics may take a while.