Fig. 3
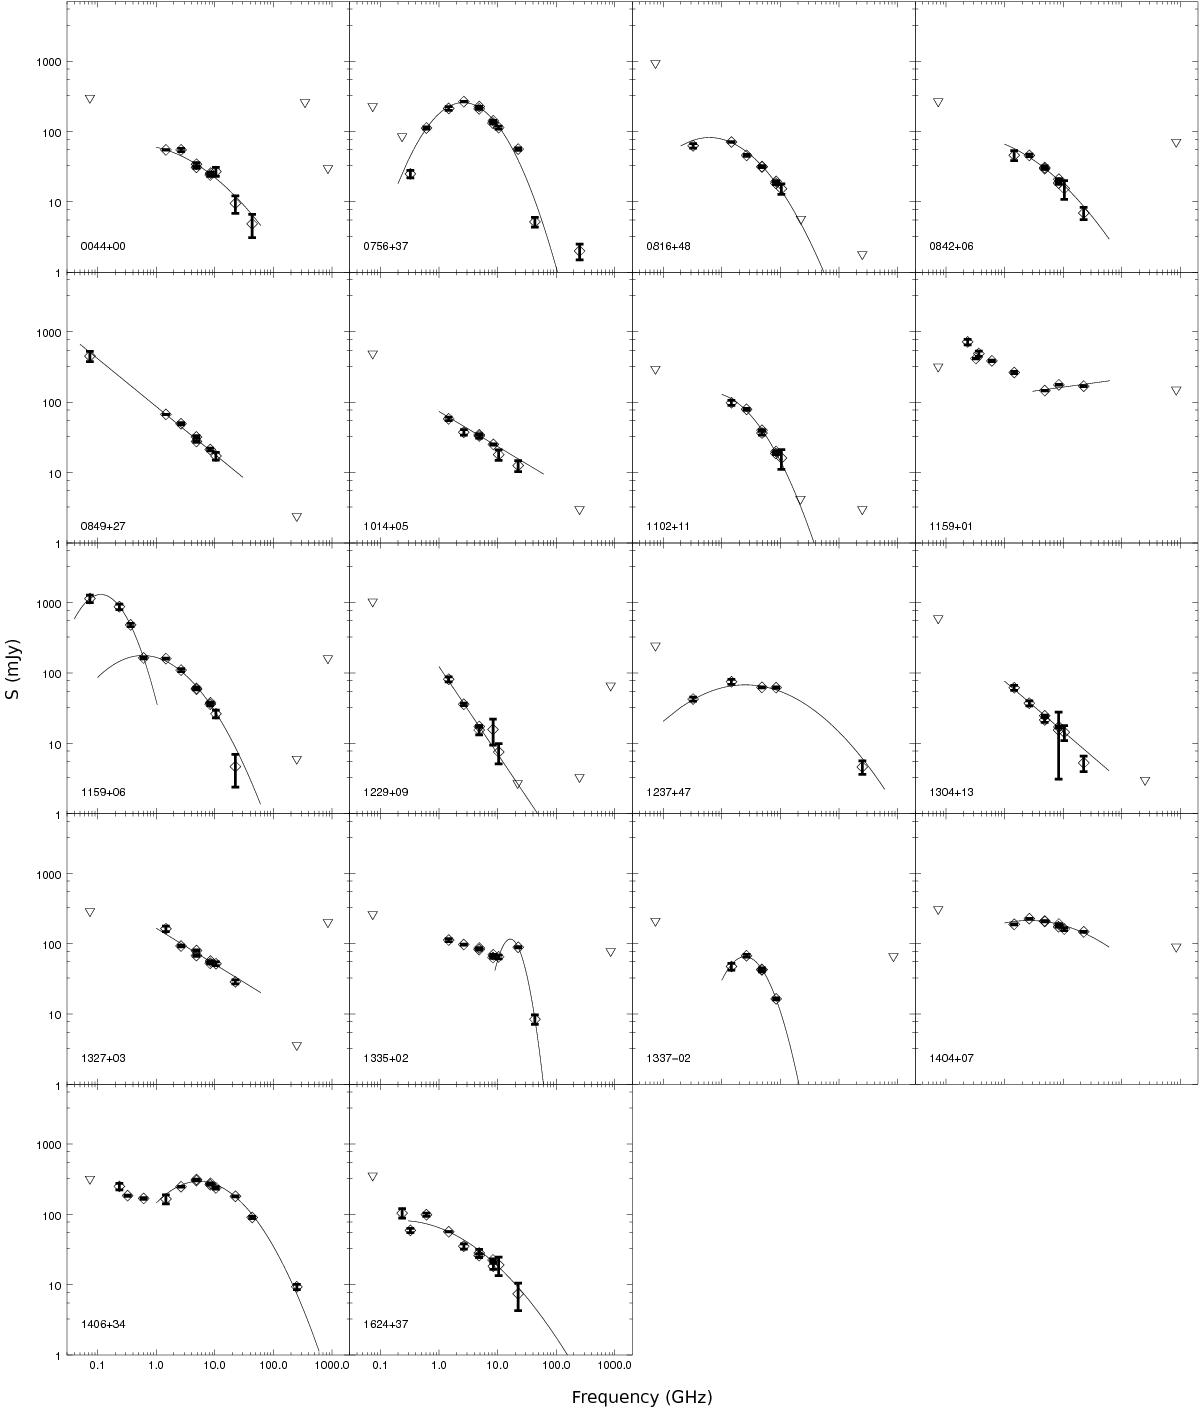
SEDs of the 18 BAL QSOs observed during the m/mm-wavelengths campaign (x-axis: GHz; y-axis: mJy). 235 MHz and 610 MHz flux densities from the GMRT; 250 GHz flux densities from IRAM-30 m; 345 and 850 GHz flux densities from APEX. Measurements at other frequencies are taken from Bruni et al. (2012), or from our polarimetry campaign (see Sect. 3). Triangles are 3σ upper limits. Solid lines are parabolic or linear fits, according to the criteria discussed in Sect. 4.2.
Current usage metrics show cumulative count of Article Views (full-text article views including HTML views, PDF and ePub downloads, according to the available data) and Abstracts Views on Vision4Press platform.
Data correspond to usage on the plateform after 2015. The current usage metrics is available 48-96 hours after online publication and is updated daily on week days.
Initial download of the metrics may take a while.