Free Access
Fig. 2
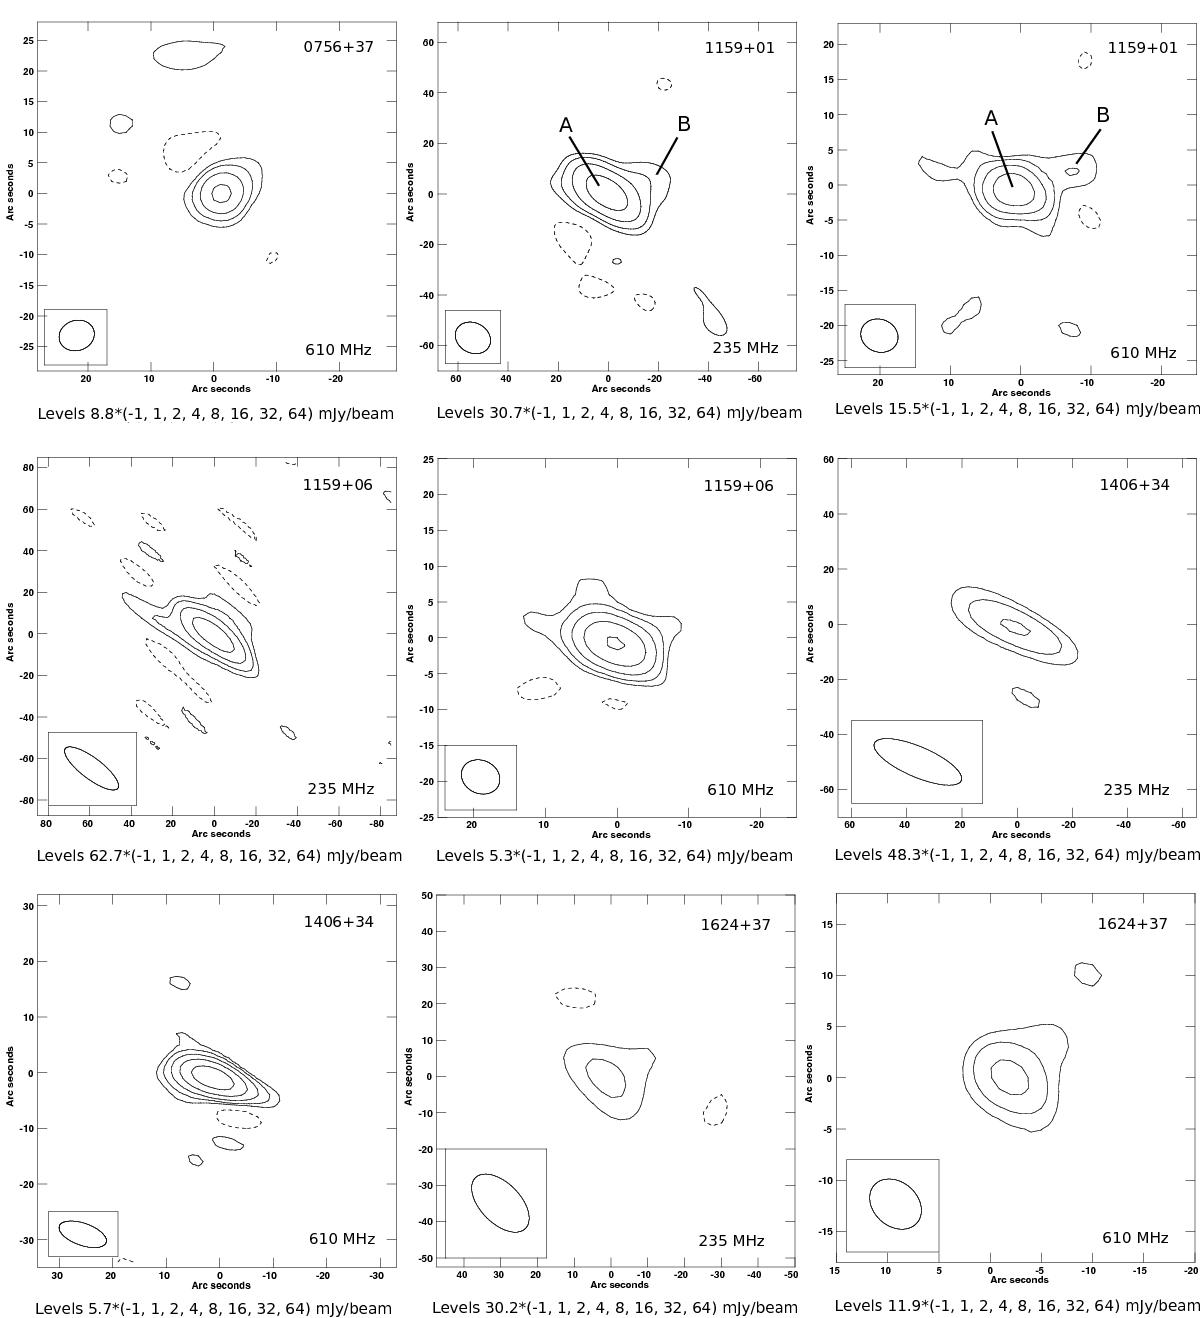
Maps of 5 BAL QSOs observed with the GMRT at 235 and 610 MHz. Contours are multiples of 3σ, according to the label. Dashed contours are negative. The synthesised beam size is shown in the lower left corner of each map.
Current usage metrics show cumulative count of Article Views (full-text article views including HTML views, PDF and ePub downloads, according to the available data) and Abstracts Views on Vision4Press platform.
Data correspond to usage on the plateform after 2015. The current usage metrics is available 48-96 hours after online publication and is updated daily on week days.
Initial download of the metrics may take a while.