Fig. 4
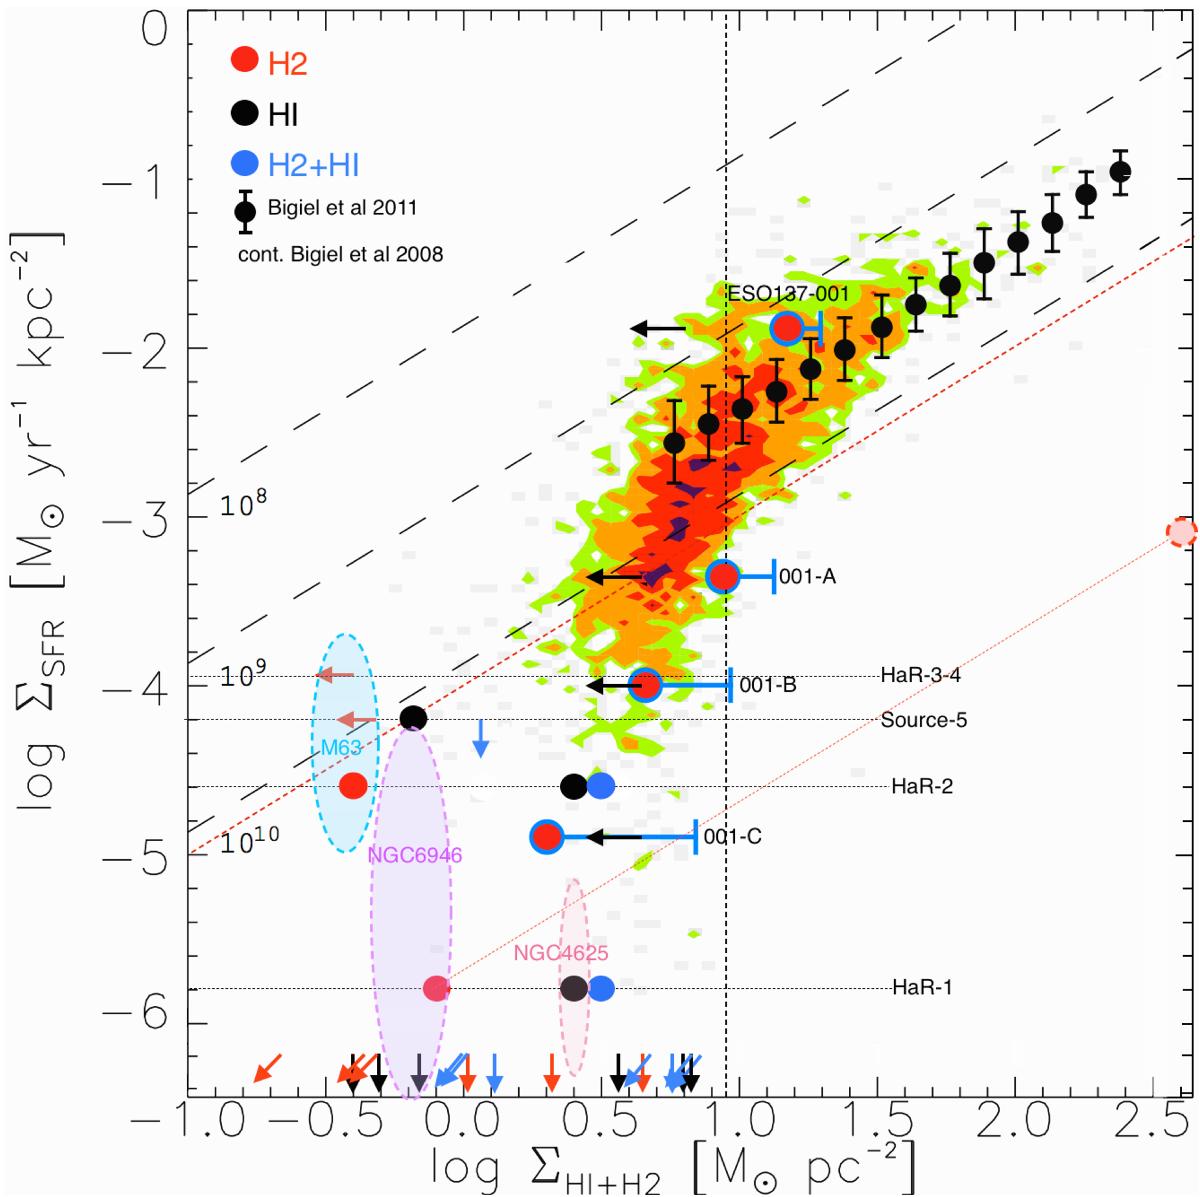
S-K relation for sources in Table 4, with filled circles and arrows for values and upper limits, respectively. Red markers indicate H2 for Σgas, black markers HI, and blue ones the sum of both. Figure adapted from Jáchym et al. (2014), where their sources ESO137-001, 001-A, 001-B, and 001-C were plotted in a similar way as ours: red circles for H2 gas, black left arrows for HI upper limits, and blue “error bars” to account for both gas components. Colored contours account for the spiral galaxies from Bigiel et al. 2008 (green, orange, red, and purple for 1, 2, 5, and 10 sampling points per 0.05 dex, respectively). Black markers with error bars correspond to the running medians in ΣSFR as a function of σH2 of 30 nearby galaxies from Bigiel et al. (2011). Shaded ovals represent the data from the outer parts of XUV disk galaxies: NGC 4625 and NGC 6946 from Watson et al. (2014, priv. comm.), and M63 (NGC 5055) from Dessauges-Zavadsky et al. (2014), only taking H2 into account in all of them. The dashed vertical line shows the 9 M⊙ pc-2 threshold at which the atomic gas saturates. Dashed inclined lines represent “isochrones” of constant star formation efficiencies, indicating the depletion times τdep = Σgas/ ΣSFR of 108, 109, and 1010 years to consume all the gas. The dashed red isochrone marks a depletion time equal to the age of the Universe, as one Hubble time (13.8 Gyr). A representative shift of the HaR-1 marker for ΣH2 is drawn, to show the “effective” molecular gas density at which stars would form in this region if we consider a beam correction factor of +2.68 in log space, to convert our 22′′ beam to a ~1′′ beam as in the Hα data.
Current usage metrics show cumulative count of Article Views (full-text article views including HTML views, PDF and ePub downloads, according to the available data) and Abstracts Views on Vision4Press platform.
Data correspond to usage on the plateform after 2015. The current usage metrics is available 48-96 hours after online publication and is updated daily on week days.
Initial download of the metrics may take a while.