Free Access
Fig. 2
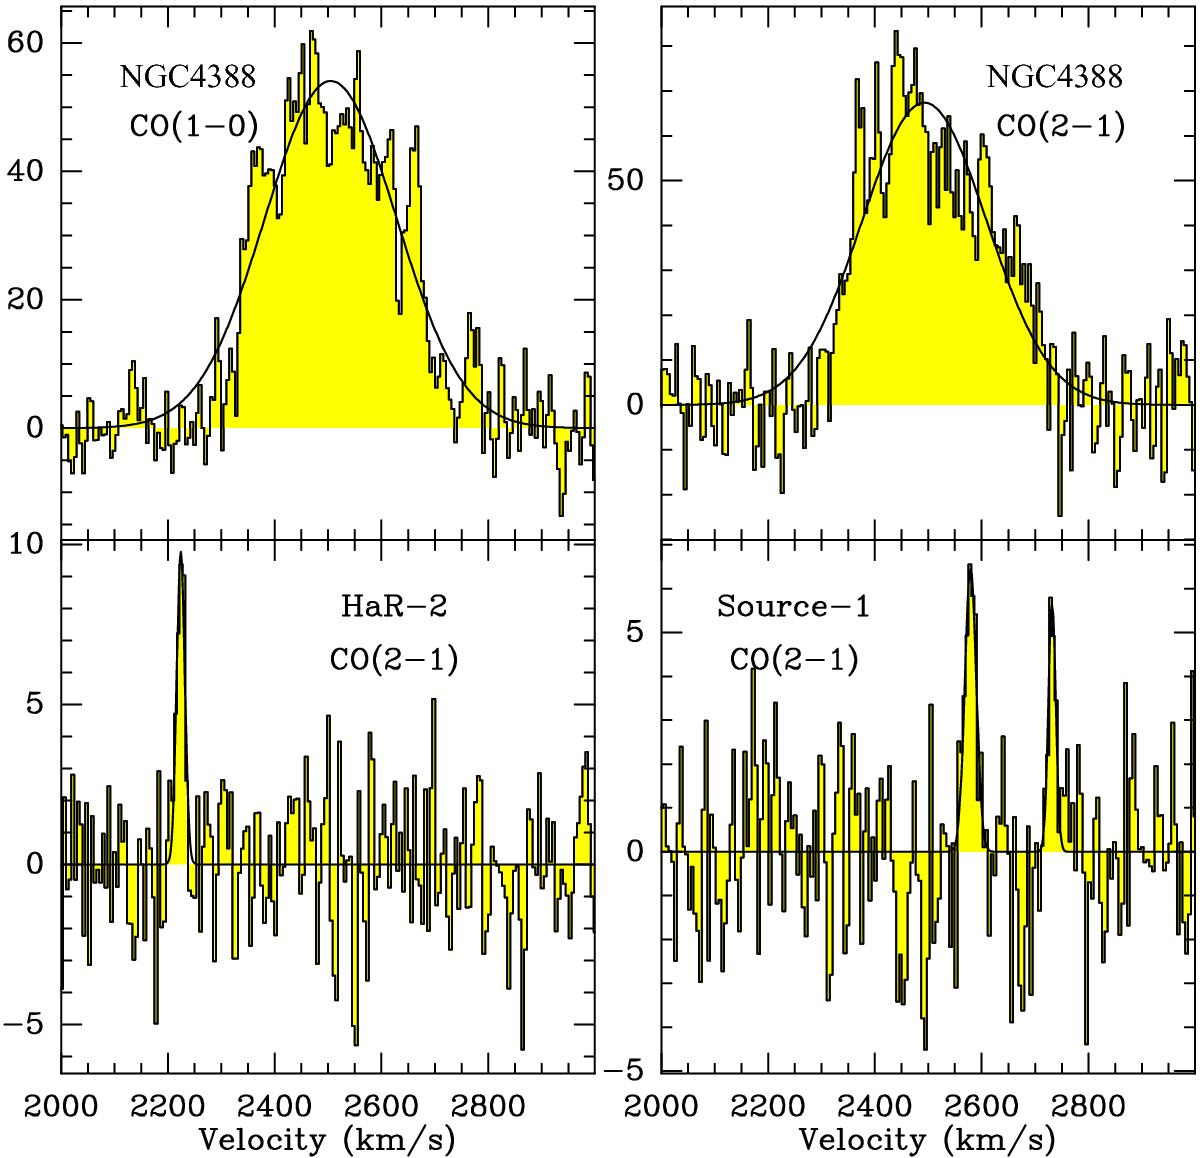
Top: spectra taken at the center of NGC 4388, observed for calibration purposes. Bottom: spectra from observing run 195-13, which showed CO emission. Spectra information and line parameters are presented in Table 2. The temperature scale corresponds to main beam temperature in mK.
Current usage metrics show cumulative count of Article Views (full-text article views including HTML views, PDF and ePub downloads, according to the available data) and Abstracts Views on Vision4Press platform.
Data correspond to usage on the plateform after 2015. The current usage metrics is available 48-96 hours after online publication and is updated daily on week days.
Initial download of the metrics may take a while.