Free Access
Fig. 5
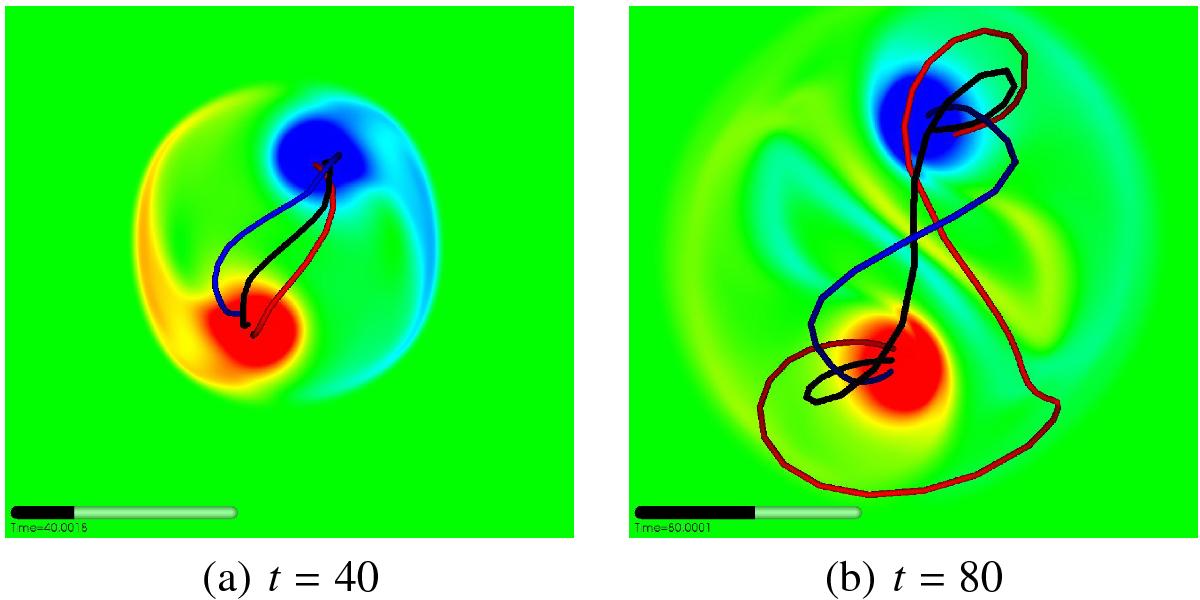
Visualisation of the axis of the flux tube (black fieldline) as well as two fieldlines (red and blue) spaced either side of the axis for comparison at selected times. A movie of this figure is available online.
This figure is made of several images, please see below:
Current usage metrics show cumulative count of Article Views (full-text article views including HTML views, PDF and ePub downloads, according to the available data) and Abstracts Views on Vision4Press platform.
Data correspond to usage on the plateform after 2015. The current usage metrics is available 48-96 hours after online publication and is updated daily on week days.
Initial download of the metrics may take a while.