Free Access
Fig. 1
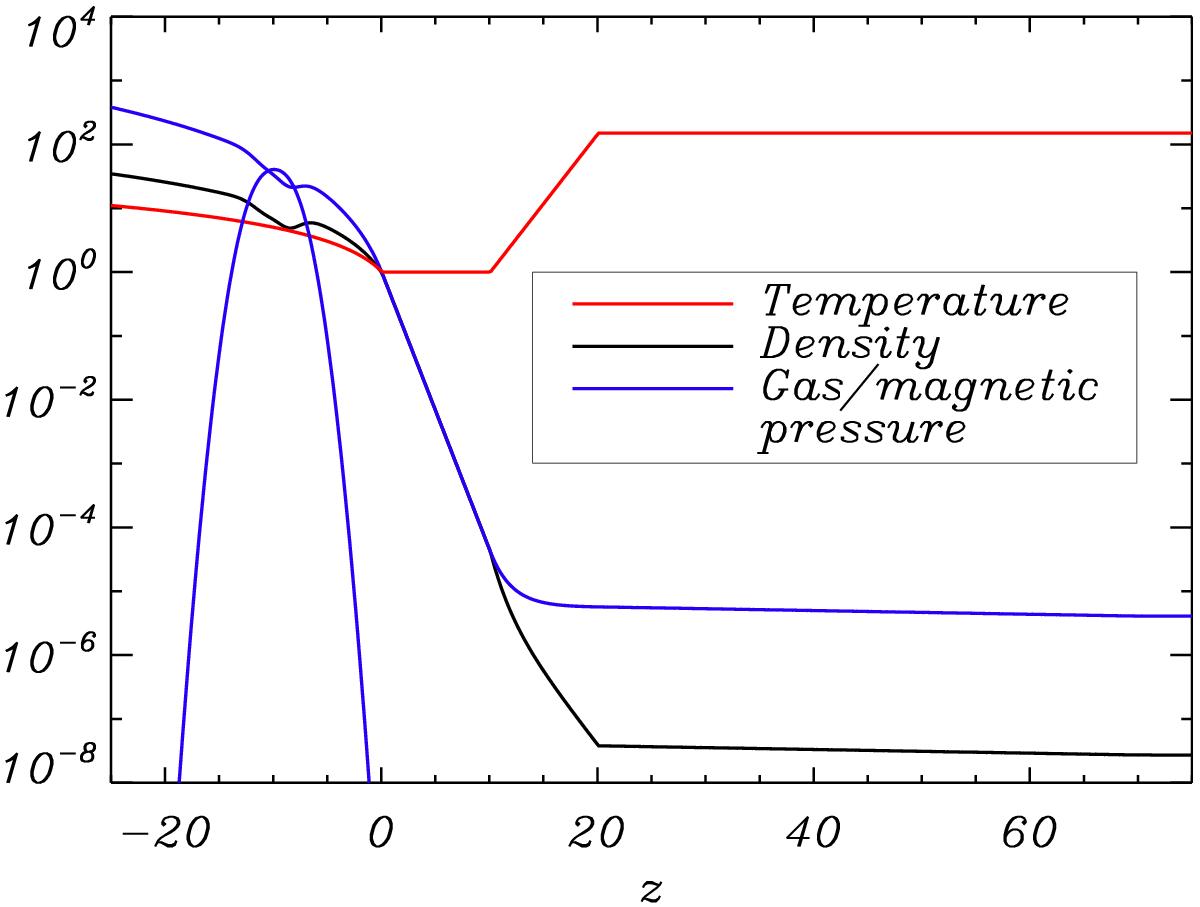
Initial stratification of model atmosphere. The initial profiles are plotted on a log scale against height where red denotes the temperature distribution, black denotes the density and blue represents the magnetic pressure in the solar interior and the gas pressure throughout the domain.
Current usage metrics show cumulative count of Article Views (full-text article views including HTML views, PDF and ePub downloads, according to the available data) and Abstracts Views on Vision4Press platform.
Data correspond to usage on the plateform after 2015. The current usage metrics is available 48-96 hours after online publication and is updated daily on week days.
Initial download of the metrics may take a while.