Fig. 13
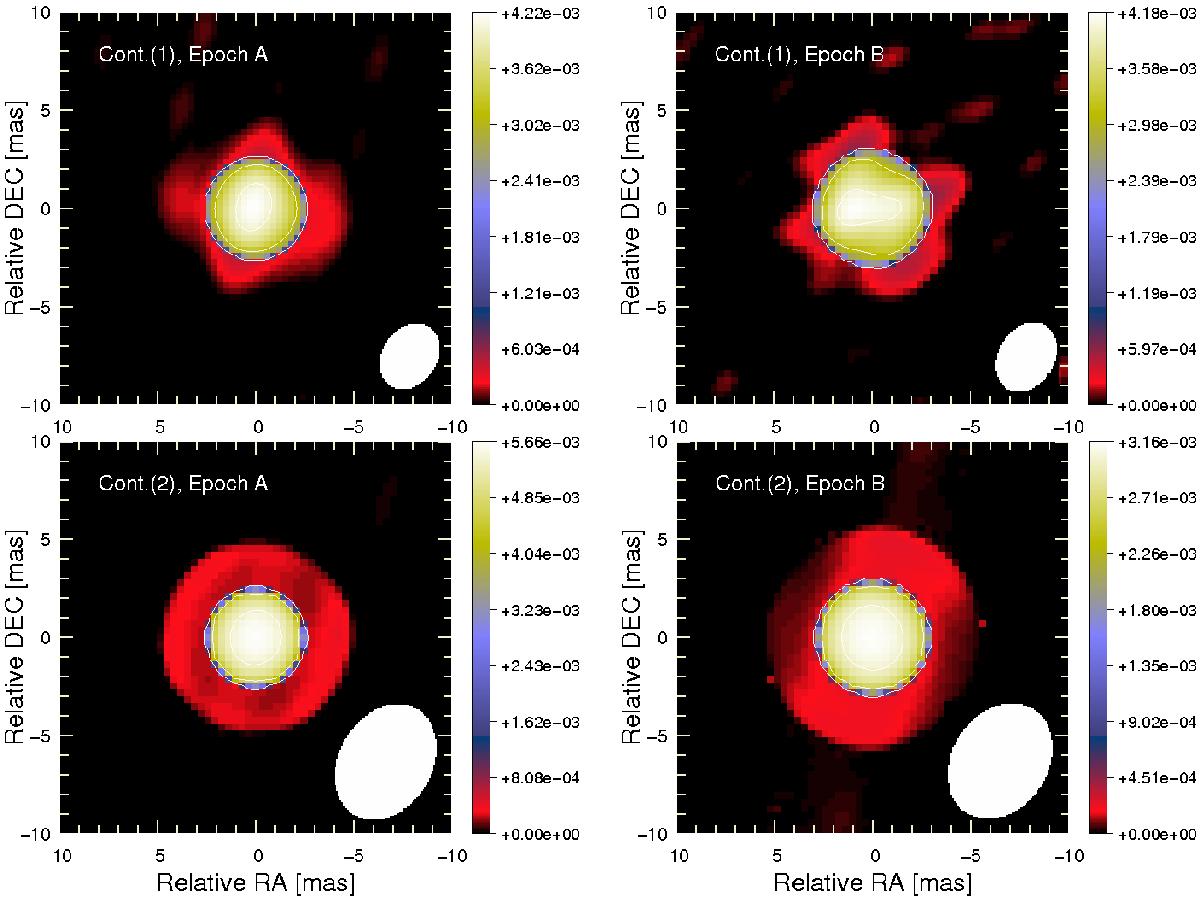
Reconstructed images with MiRA for spectral bands 1 and 5 corresponding to the continuum bands at epochs A (left column) and B (right column). The interferometric beam size is displayed in the bottom right corner of each image. White contours represent iso-intensity levels of 25%, 75% and 95% of the maximum intensity of the image.
Current usage metrics show cumulative count of Article Views (full-text article views including HTML views, PDF and ePub downloads, according to the available data) and Abstracts Views on Vision4Press platform.
Data correspond to usage on the plateform after 2015. The current usage metrics is available 48-96 hours after online publication and is updated daily on week days.
Initial download of the metrics may take a while.