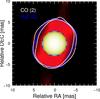
Fig. 16
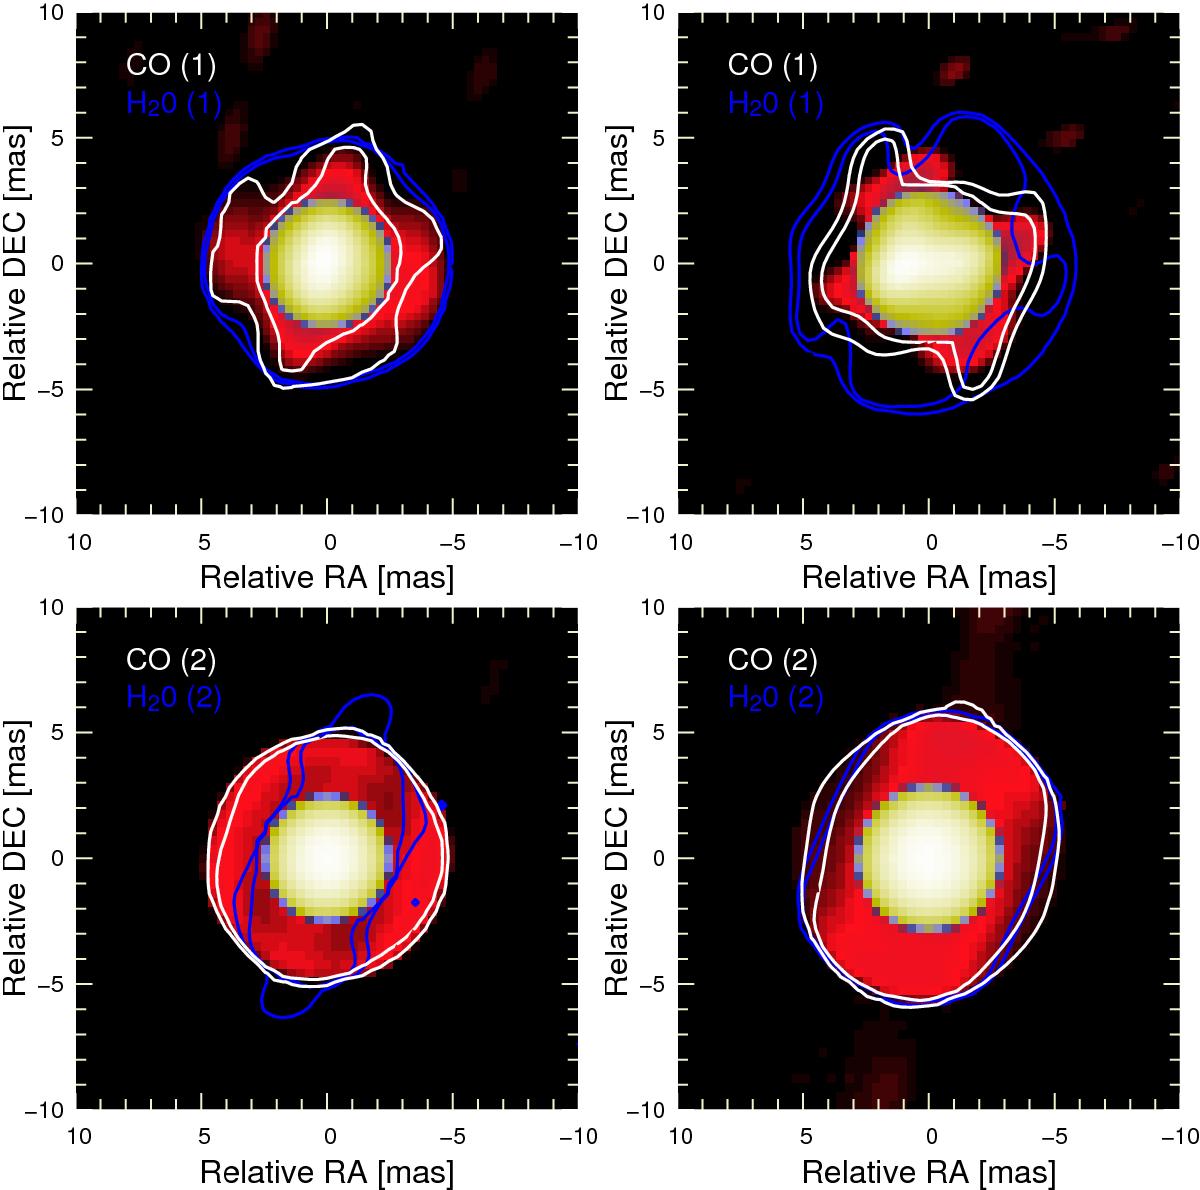
Continuum images overplotted (Fig. 13) with H2O (blue) and CO (white) intensity contours (from Figs. 14 and 15). Intensity contour levels represent 2% and 5% of the maximum intensity of each image and allow comparing the extension and shape of the environment between spectral bands for epochs A (left panels) and B (right panels). The upper panels represent the Cont (1), H2O(1) and CO(1) bands, whereas the lower panels represent the Cont (2), H2O(2) and CO(2) bands.
Current usage metrics show cumulative count of Article Views (full-text article views including HTML views, PDF and ePub downloads, according to the available data) and Abstracts Views on Vision4Press platform.
Data correspond to usage on the plateform after 2015. The current usage metrics is available 48-96 hours after online publication and is updated daily on week days.
Initial download of the metrics may take a while.