Fig. B.1
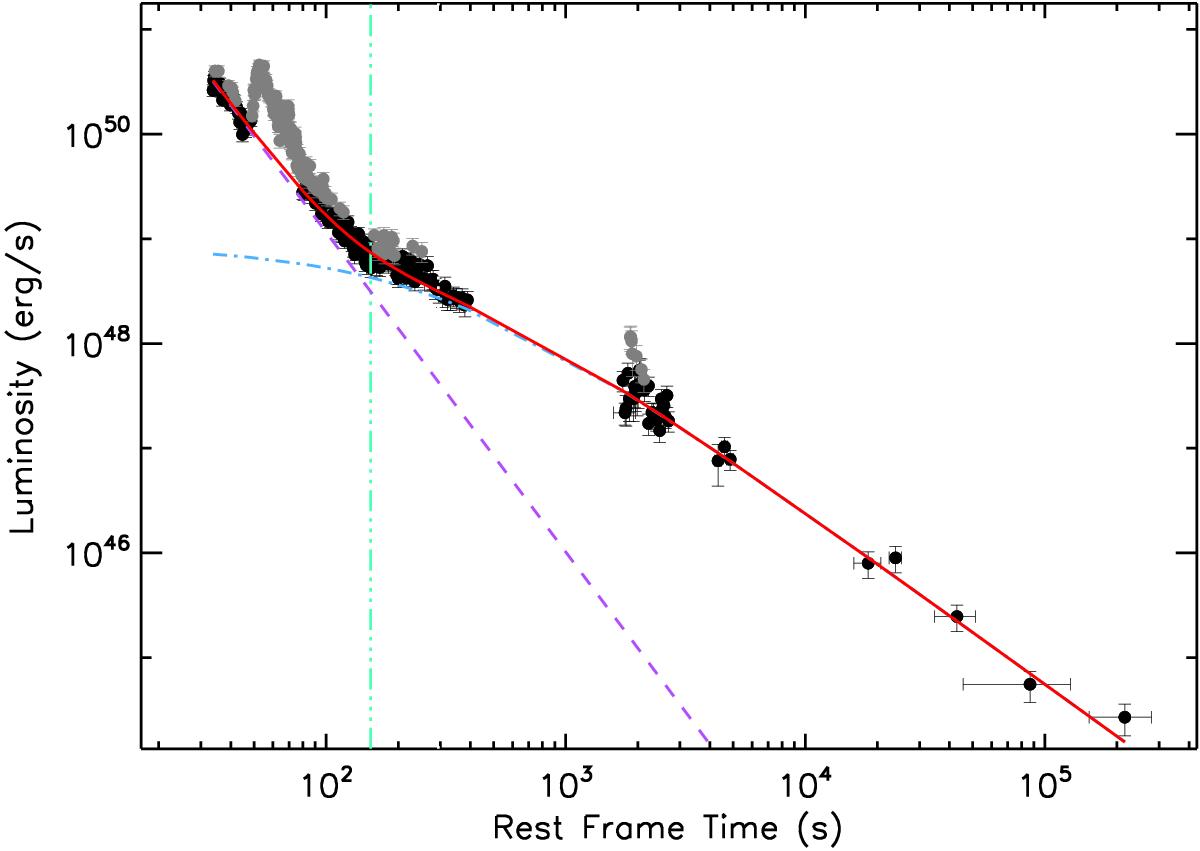
Example of the combined fitting procedure (solid red line) as described in Eqs. (3) and (B.1), filtered by the flares. The early steep decay fitted by using the power-law function in Eq. (B.1) is indicated by the purple dashed line, while the afterglow additional component is fitted by the phenomenological function in Eq. (3) (see also R14), and described by the dot-dashed cyan curve. In this specific case, the luminosity light curve of GRB 060418 is shown in which the black dots with the error bars are the flare-free data, the grey dots are the excluded data recognized as due to the flares. The vertical green dotted line indicates the characteristic timescale of the parameter τ.
Current usage metrics show cumulative count of Article Views (full-text article views including HTML views, PDF and ePub downloads, according to the available data) and Abstracts Views on Vision4Press platform.
Data correspond to usage on the plateform after 2015. The current usage metrics is available 48-96 hours after online publication and is updated daily on week days.
Initial download of the metrics may take a while.