Free Access
Fig. 7
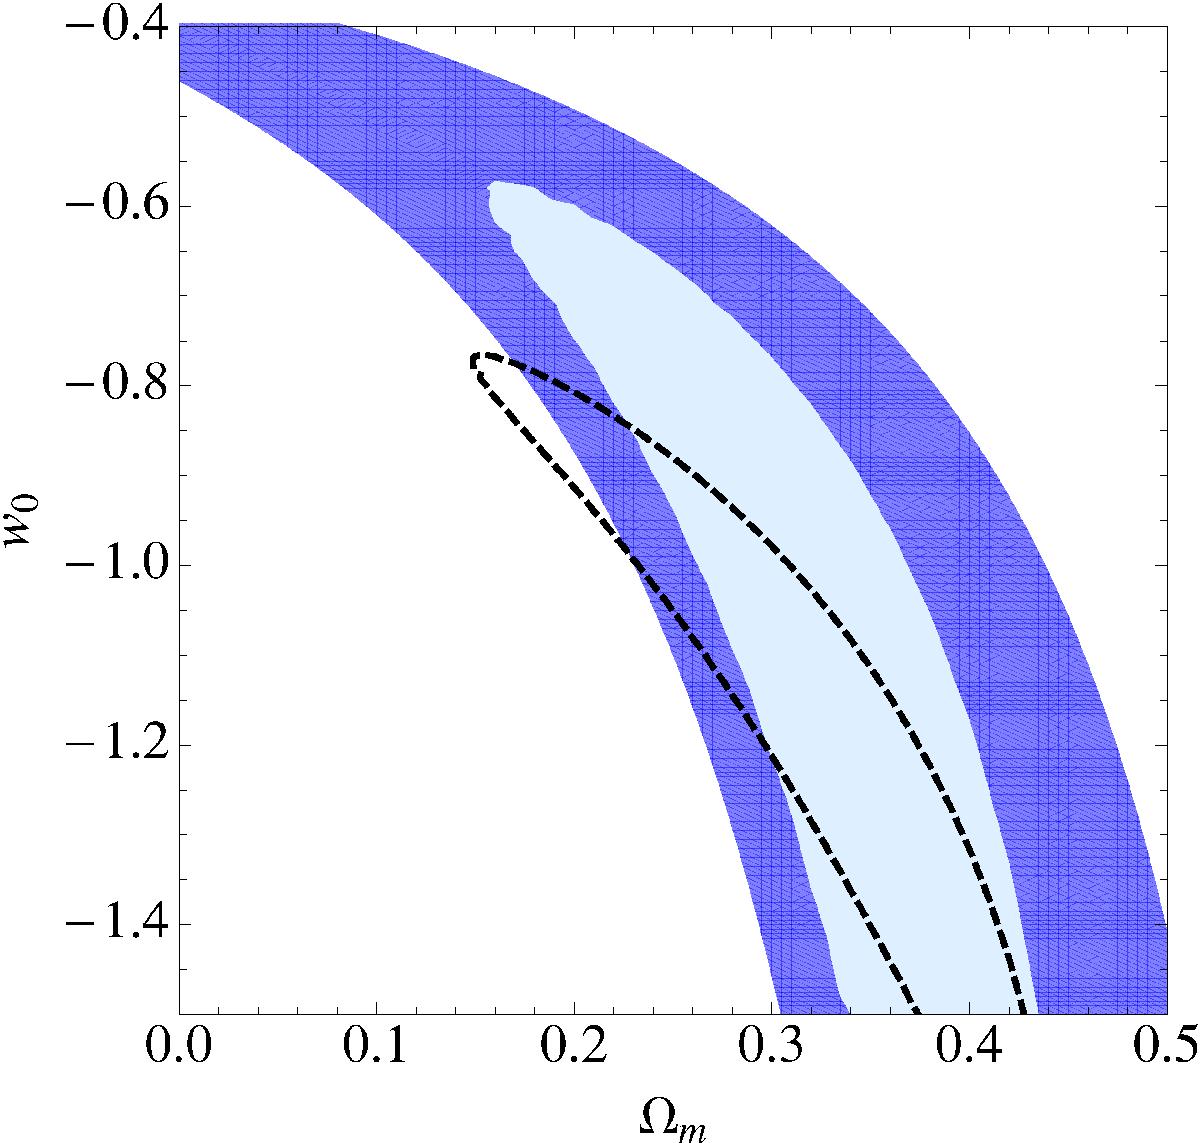
1σ(Δχ2 = 2.3) confidence region in the (Ωm, w0) plane for the Combo-GRB sample (dark blue), and for the total of 60 observed + 300 MC simulated GRBs (light blue). The black dashed line represents the 1σ confidence region obtained using the recent Union 2.1 SNe Ia sample (Suzuki et al. 2012).
Current usage metrics show cumulative count of Article Views (full-text article views including HTML views, PDF and ePub downloads, according to the available data) and Abstracts Views on Vision4Press platform.
Data correspond to usage on the plateform after 2015. The current usage metrics is available 48-96 hours after online publication and is updated daily on week days.
Initial download of the metrics may take a while.