Free Access
Fig. 5
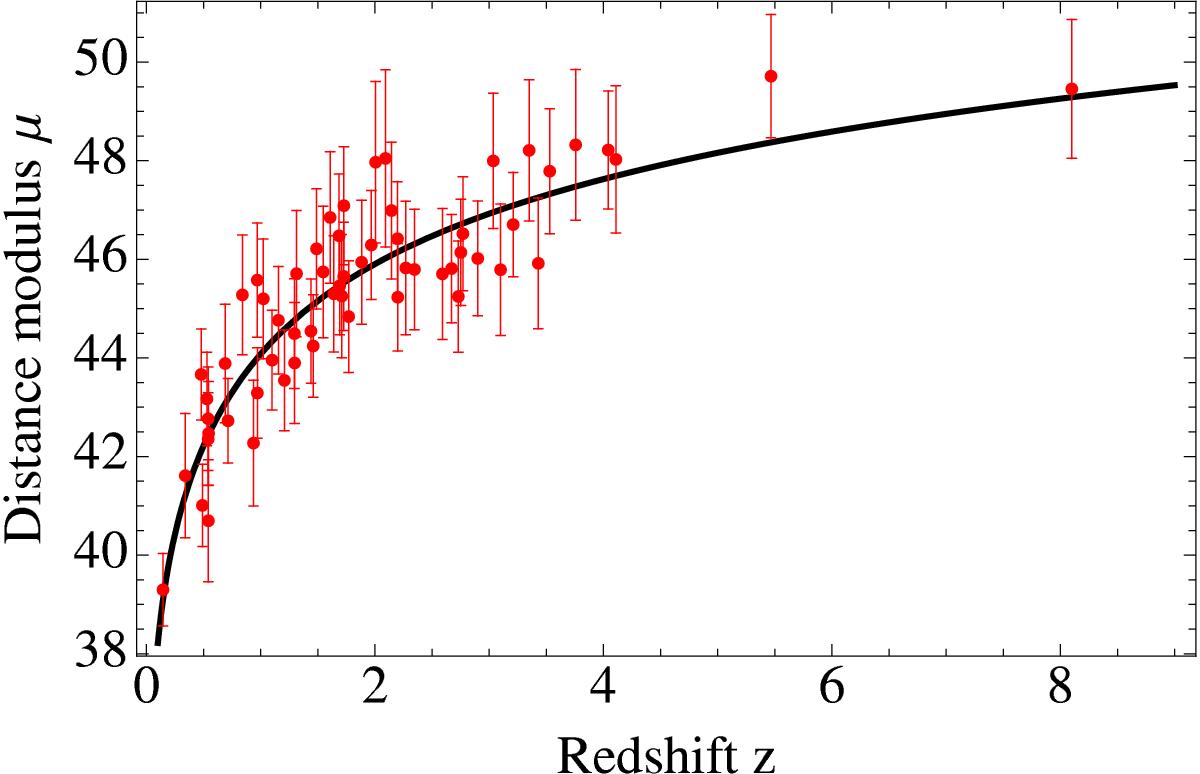
Combo-GRB Hubble diagram. The black line represents the best fit for the function μ(z) as obtained by using only GRBs and for the case of the ΛCDM scenario.
Current usage metrics show cumulative count of Article Views (full-text article views including HTML views, PDF and ePub downloads, according to the available data) and Abstracts Views on Vision4Press platform.
Data correspond to usage on the plateform after 2015. The current usage metrics is available 48-96 hours after online publication and is updated daily on week days.
Initial download of the metrics may take a while.