Fig. 2
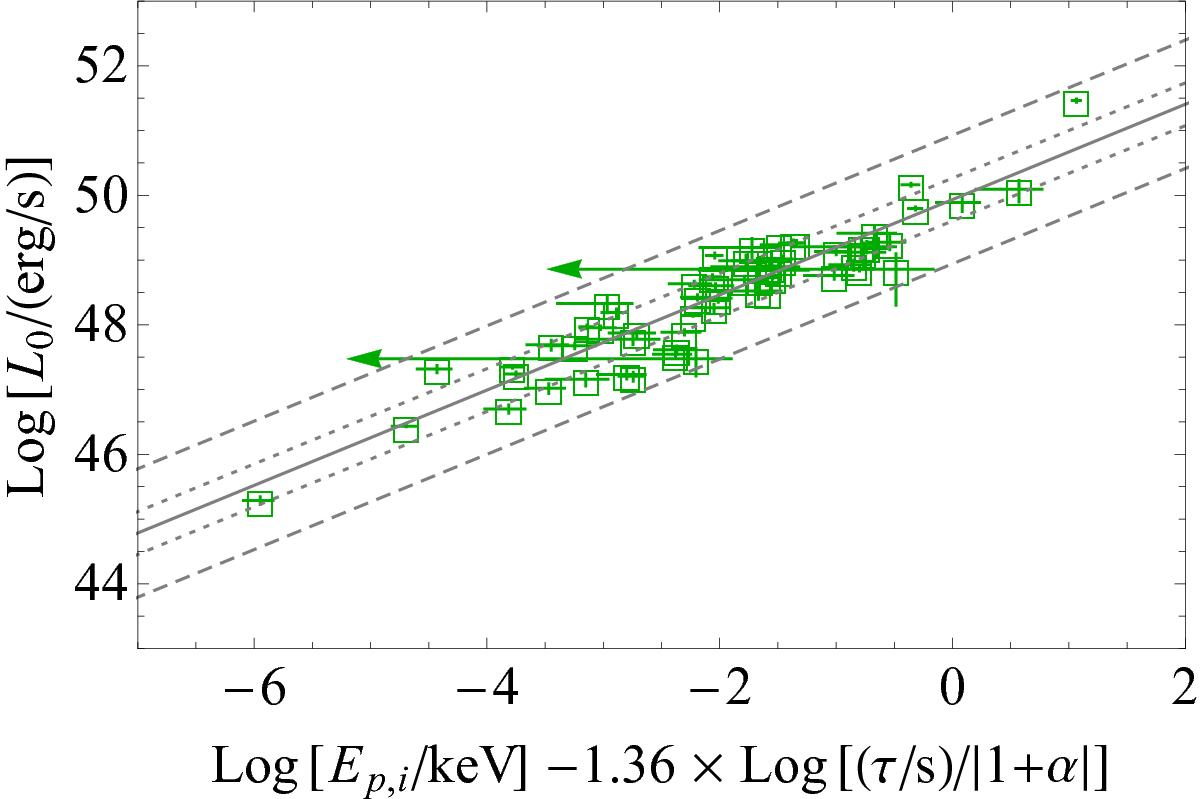
Correlation considering the entire sample of 60 GRBs. The green empty boxes are the data of each of the sources, derived as described in Appendix B, the solid black line is the best fit of the data, while the dotted grey lines and the dashed grey lines correspond, respectively, to the dispersion on the correlation at 1σex and 3σex.
Current usage metrics show cumulative count of Article Views (full-text article views including HTML views, PDF and ePub downloads, according to the available data) and Abstracts Views on Vision4Press platform.
Data correspond to usage on the plateform after 2015. The current usage metrics is available 48-96 hours after online publication and is updated daily on week days.
Initial download of the metrics may take a while.