Fig. 12
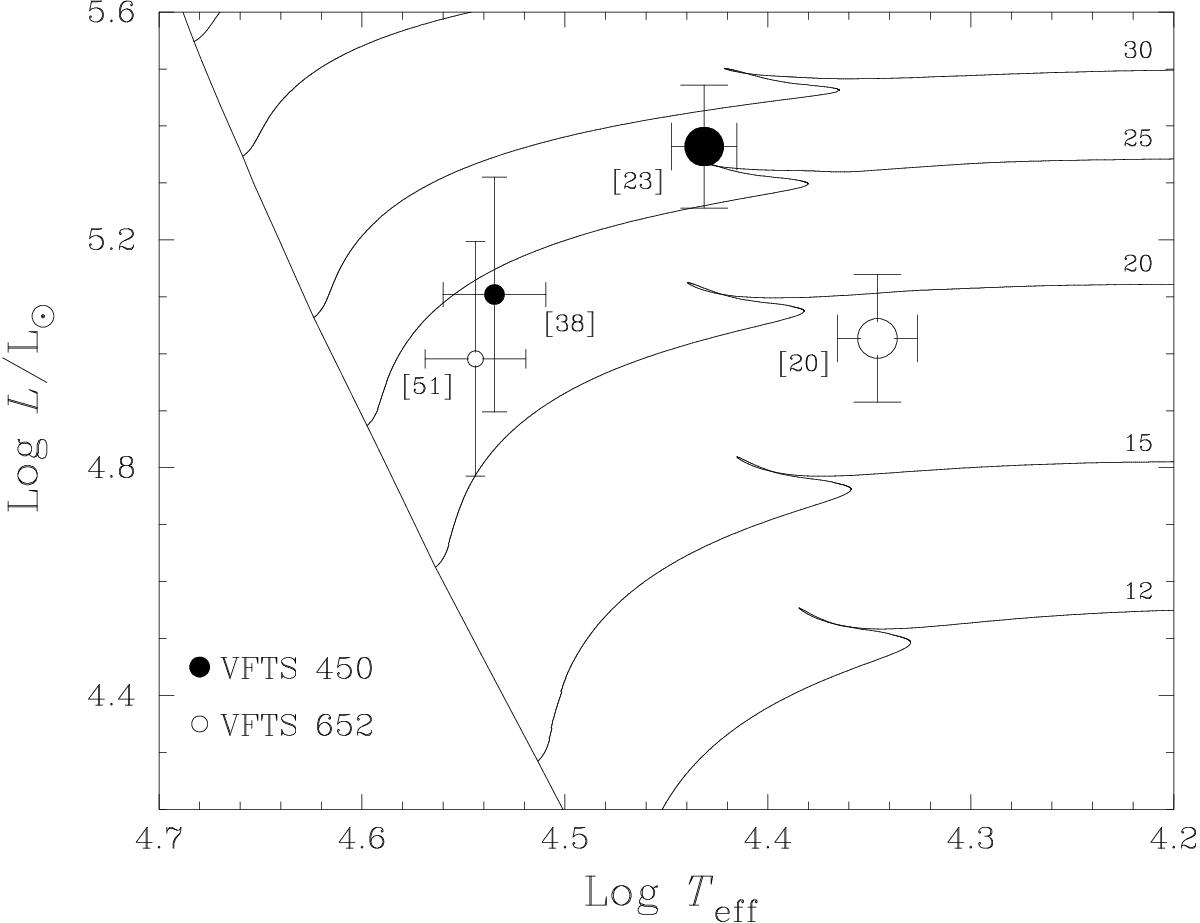
Stellar parameters from Table 8, plotted in the Hertzprung-Russell diagram. Error bars illustrate uncertainties of ± 1 kK on primaries (larger symbols) and ± 2 kK on secondaries, and the sums in quadrature of the error ranges on L listed in Table 8. Dynamical masses are indicated in square brackets. Evolutionary tracks from Brott et al. (2011a) for single, non-rotating stars are shown for comparison, labelled by ZAMS mass.
Current usage metrics show cumulative count of Article Views (full-text article views including HTML views, PDF and ePub downloads, according to the available data) and Abstracts Views on Vision4Press platform.
Data correspond to usage on the plateform after 2015. The current usage metrics is available 48-96 hours after online publication and is updated daily on week days.
Initial download of the metrics may take a while.