Fig. 4
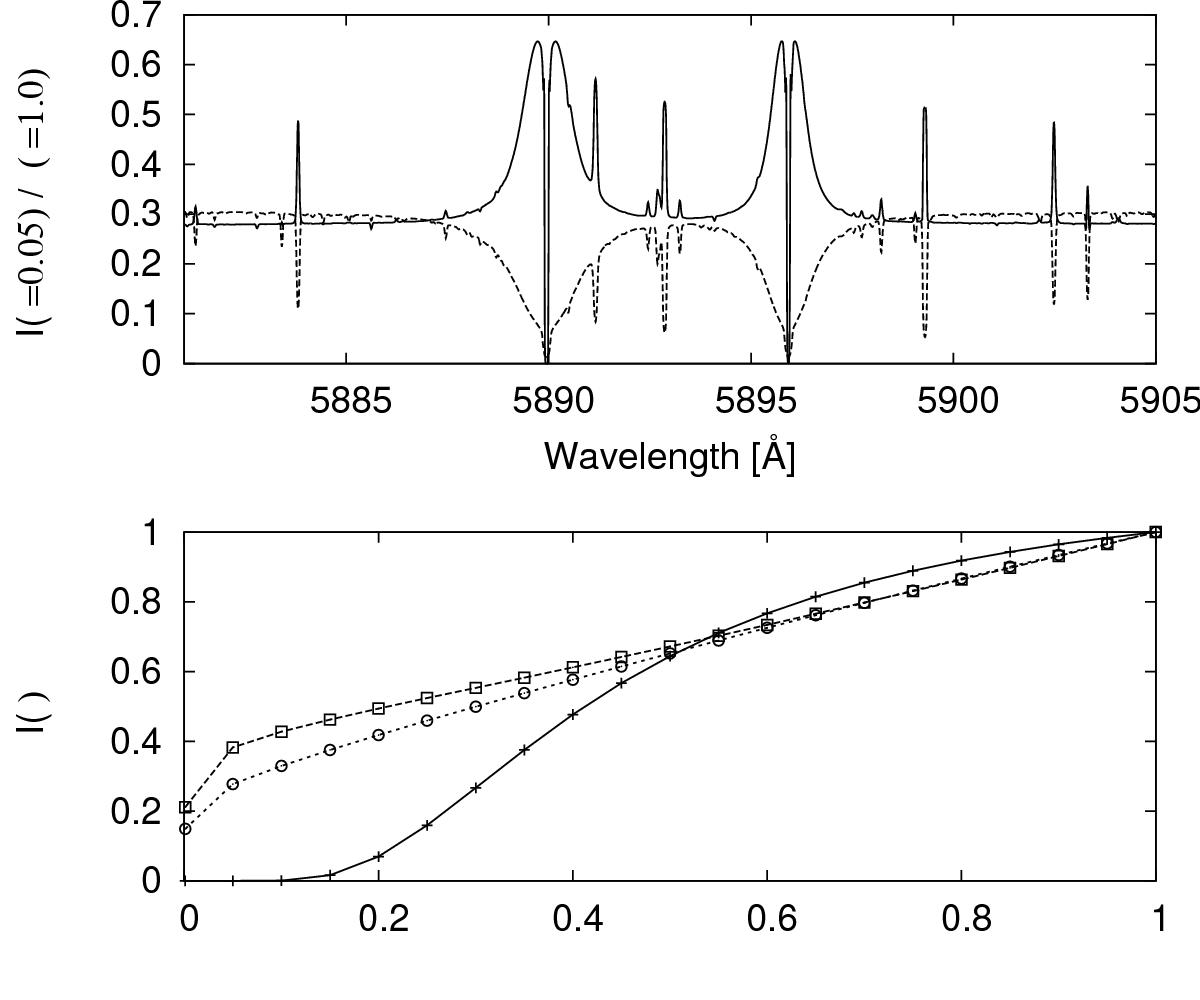
Top: ratio of stellar spectra (Teff = 5000 K, log (g) = 4.5) at limb and center (μ = 0.05 and μ = 1.0) shown with a solid line. For comparison, the scaled central spectrum (dashed line). Bottom: normalized specific intensity in the μ = 0.001−1 range in the line core (5889.95 Å, crosses), the line wing (5889 Å, squares), and the quasi-continuum (5864.6 Å, circles).
Current usage metrics show cumulative count of Article Views (full-text article views including HTML views, PDF and ePub downloads, according to the available data) and Abstracts Views on Vision4Press platform.
Data correspond to usage on the plateform after 2015. The current usage metrics is available 48-96 hours after online publication and is updated daily on week days.
Initial download of the metrics may take a while.