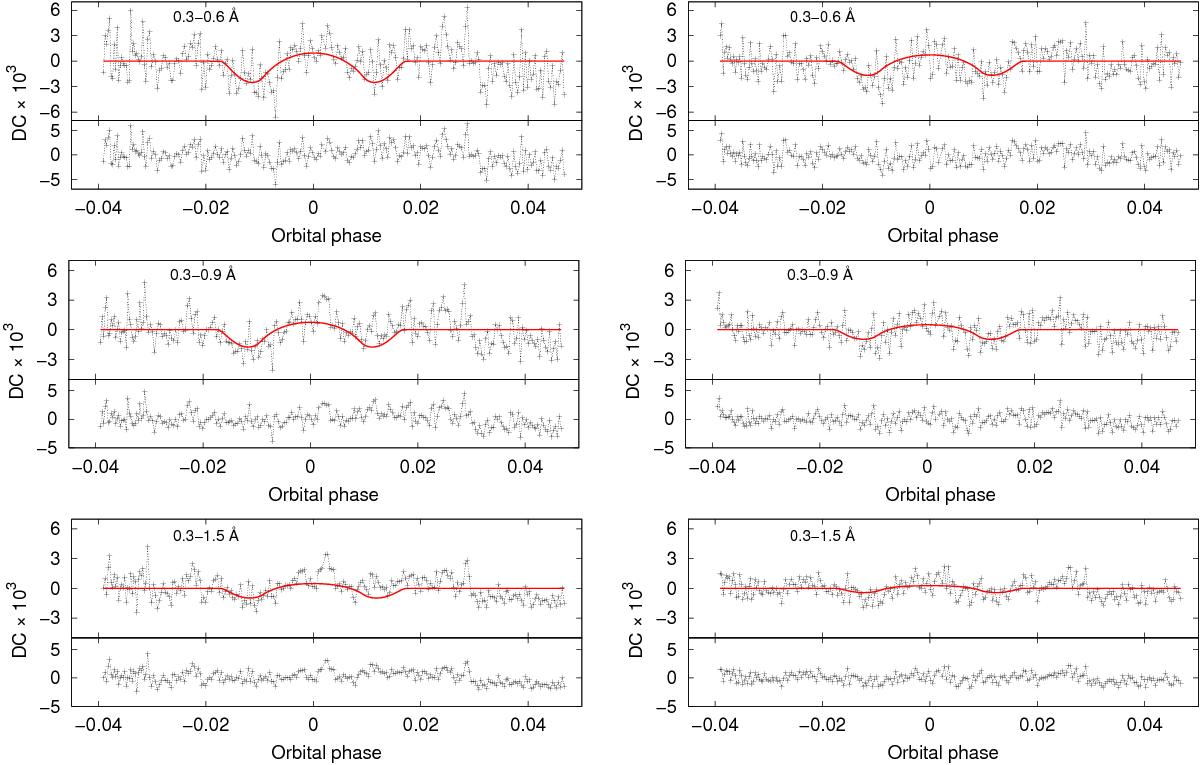
Fig. 18

Difference curves for Na iD2 (left column) and D1 (right column) for three feature bands with half-widths of 0.6 Å, 0.9 Å, and 1.5 Å (top to bottom). Top panels show the data and the model (solid, red line), and the bottom show the residuals. The line core (± 0.3 Å around the line center) has been excluded. The reference bands were 5840−5860 Å and 5925.875−5945.875 Å. The effect of the CLV is different in the two lines and it is weaker for broader spectral bands.
Current usage metrics show cumulative count of Article Views (full-text article views including HTML views, PDF and ePub downloads, according to the available data) and Abstracts Views on Vision4Press platform.
Data correspond to usage on the plateform after 2015. The current usage metrics is available 48-96 hours after online publication and is updated daily on week days.
Initial download of the metrics may take a while.


