Fig. 12
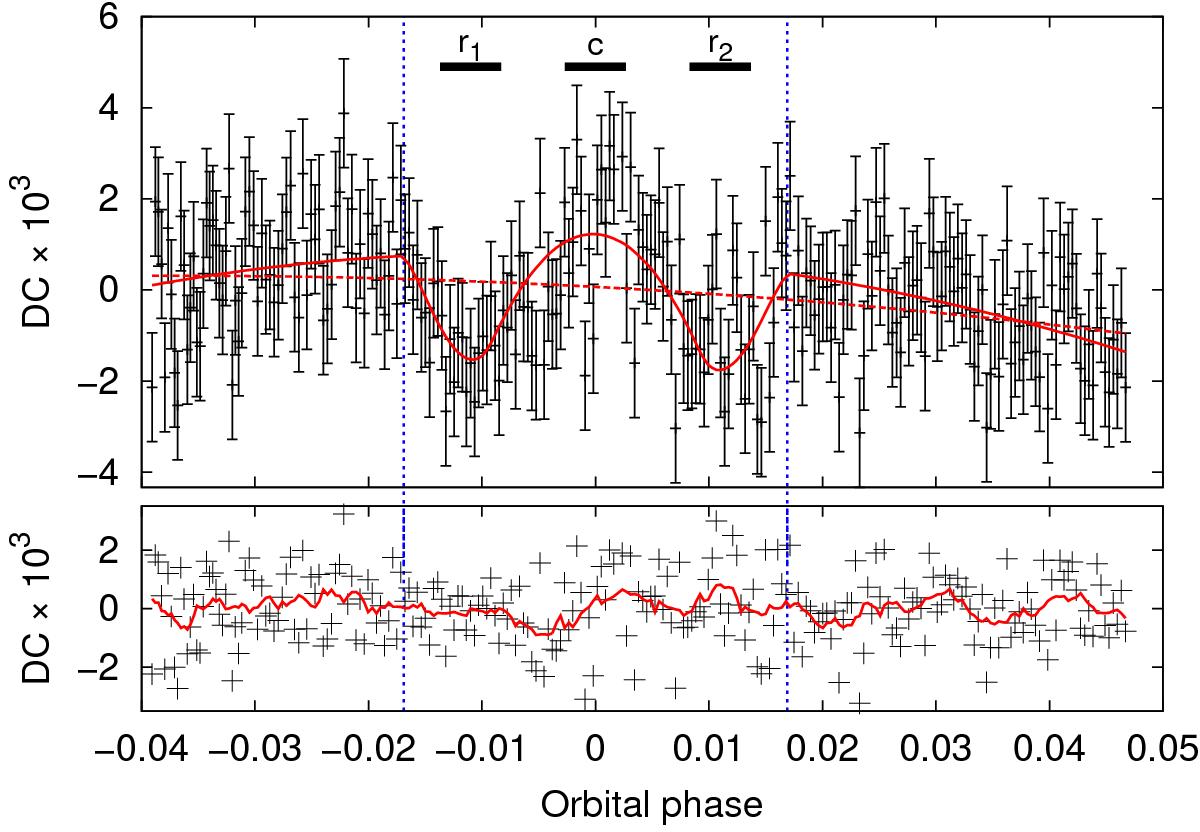
Combined DC of the Ca ii H and K lines wings along with our best-fit second order polynomial model (dashed) and our best-fit model including the synthetic DC. The bottom panel gives the residuals with respect to our DC model. The solid (red) line shows the residuals smoothed by a running mean with a width of eight data points. The vertical lines indicate the transit duration and the three top bars indicate the phase intervals used in the analysis of the spectra.
Current usage metrics show cumulative count of Article Views (full-text article views including HTML views, PDF and ePub downloads, according to the available data) and Abstracts Views on Vision4Press platform.
Data correspond to usage on the plateform after 2015. The current usage metrics is available 48-96 hours after online publication and is updated daily on week days.
Initial download of the metrics may take a while.