Free Access
Fig. 12
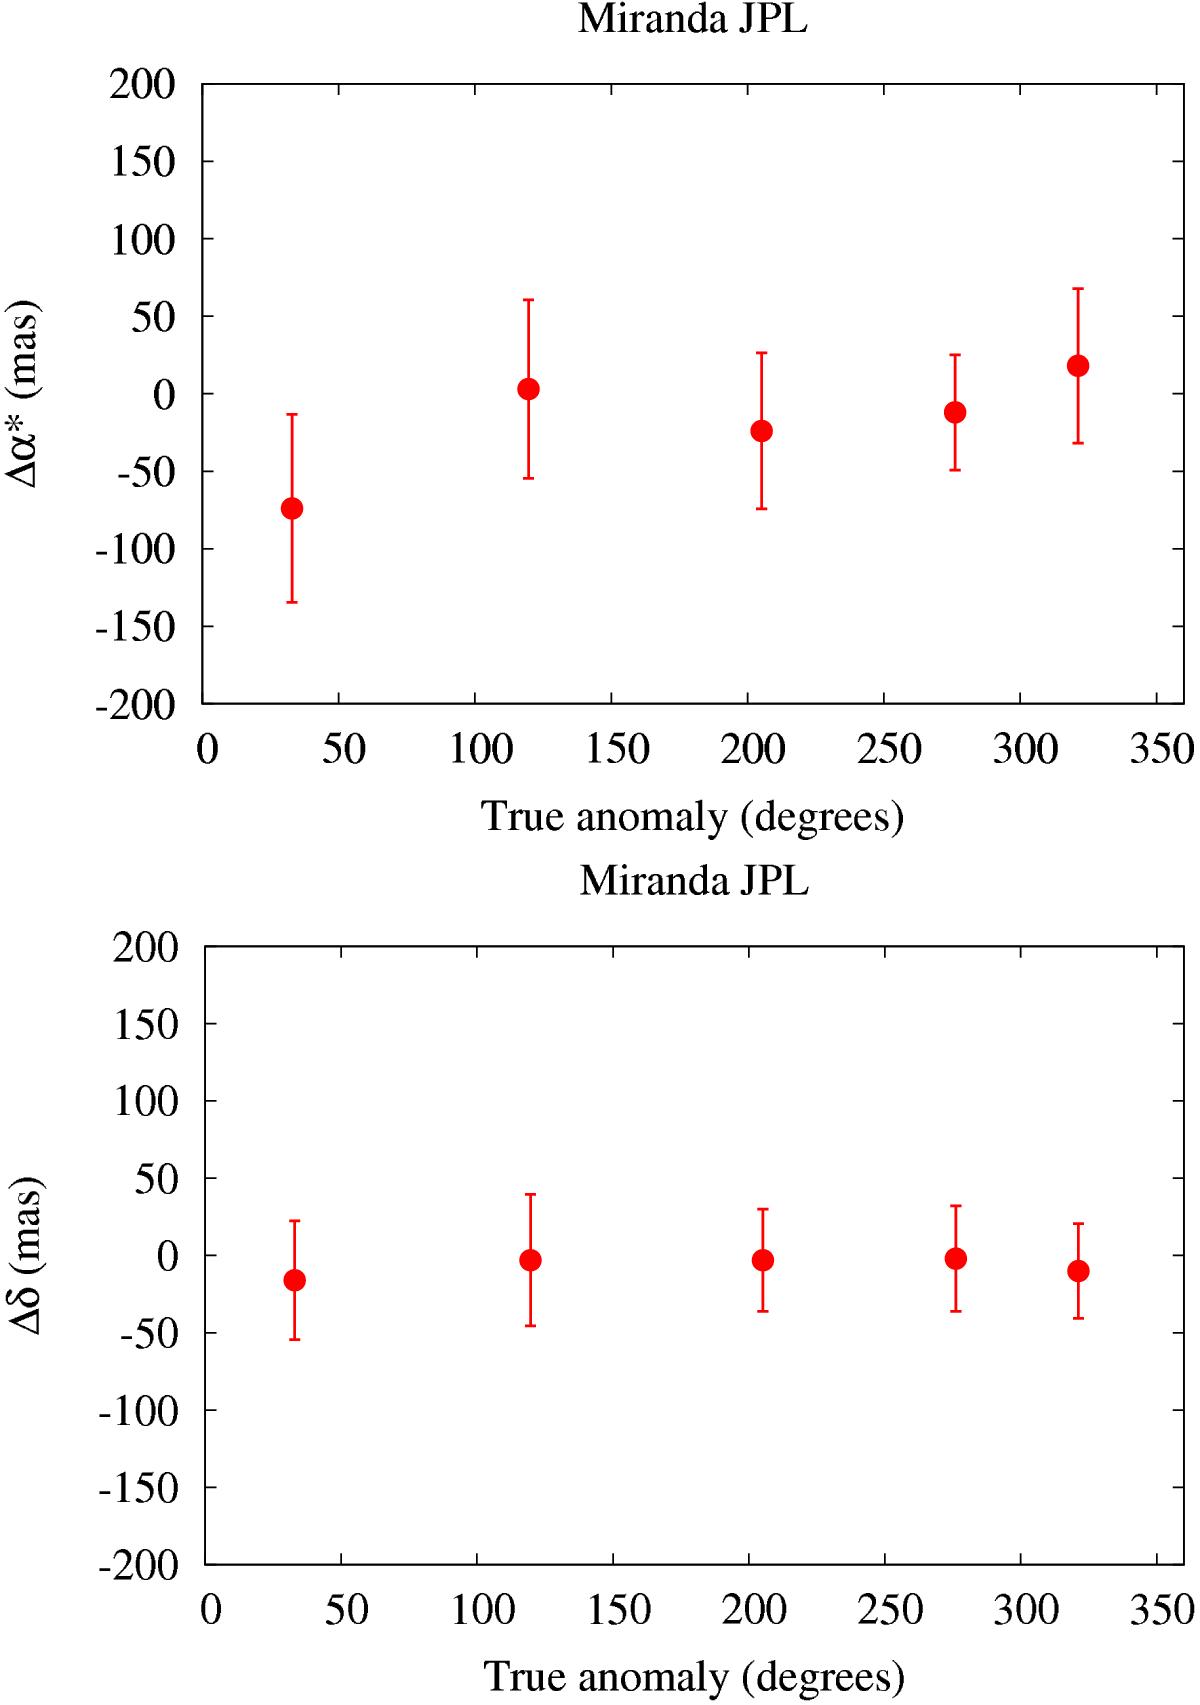
Distribution of the offsets for Miranda as a function of the true anomaly. Solid dots: orbit view close to face-on. Note that there were not enough positions of Miranda with an orbit view close to the edge-on to appear in these plots.
This figure is made of several images, please see below:
Current usage metrics show cumulative count of Article Views (full-text article views including HTML views, PDF and ePub downloads, according to the available data) and Abstracts Views on Vision4Press platform.
Data correspond to usage on the plateform after 2015. The current usage metrics is available 48-96 hours after online publication and is updated daily on week days.
Initial download of the metrics may take a while.