Fig. 7
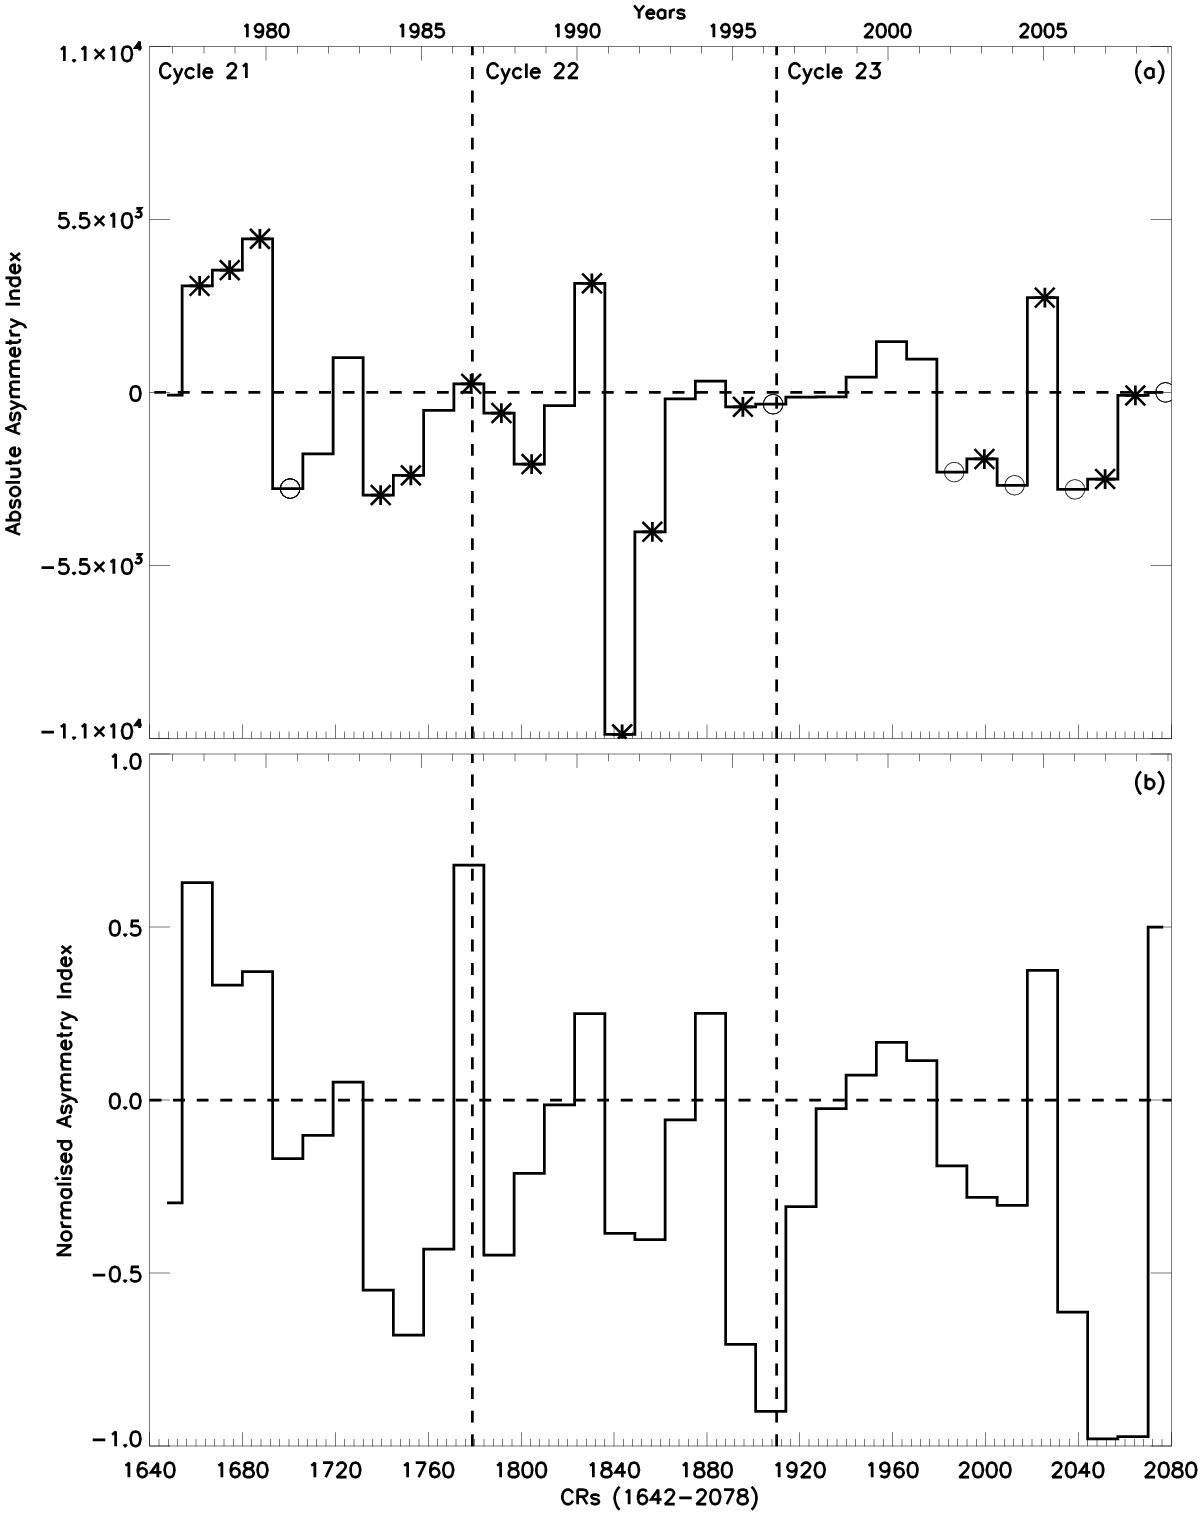
North–south (N–S) asymmetry of FISXR during solar cycles 21, 22, and 23. The asymmetry has been represented by absolute asymmetry index (panel a)) as well as normalized asymmetry index (panel b)). The FISXR is averaged over 13 Carrington rotations for the asymmetry analysis. Vertical dashed lines indicate solar activity minima. The statistical significance of N–S asymmetry is assessed by Student’s t-test and the results are marked by circle/asterisk symbols in top panel. Here asterisks and circles represent N–S asymmetry with significance levels of ≥95% and 80–95%, respectively.
Current usage metrics show cumulative count of Article Views (full-text article views including HTML views, PDF and ePub downloads, according to the available data) and Abstracts Views on Vision4Press platform.
Data correspond to usage on the plateform after 2015. The current usage metrics is available 48-96 hours after online publication and is updated daily on week days.
Initial download of the metrics may take a while.