Fig. 5
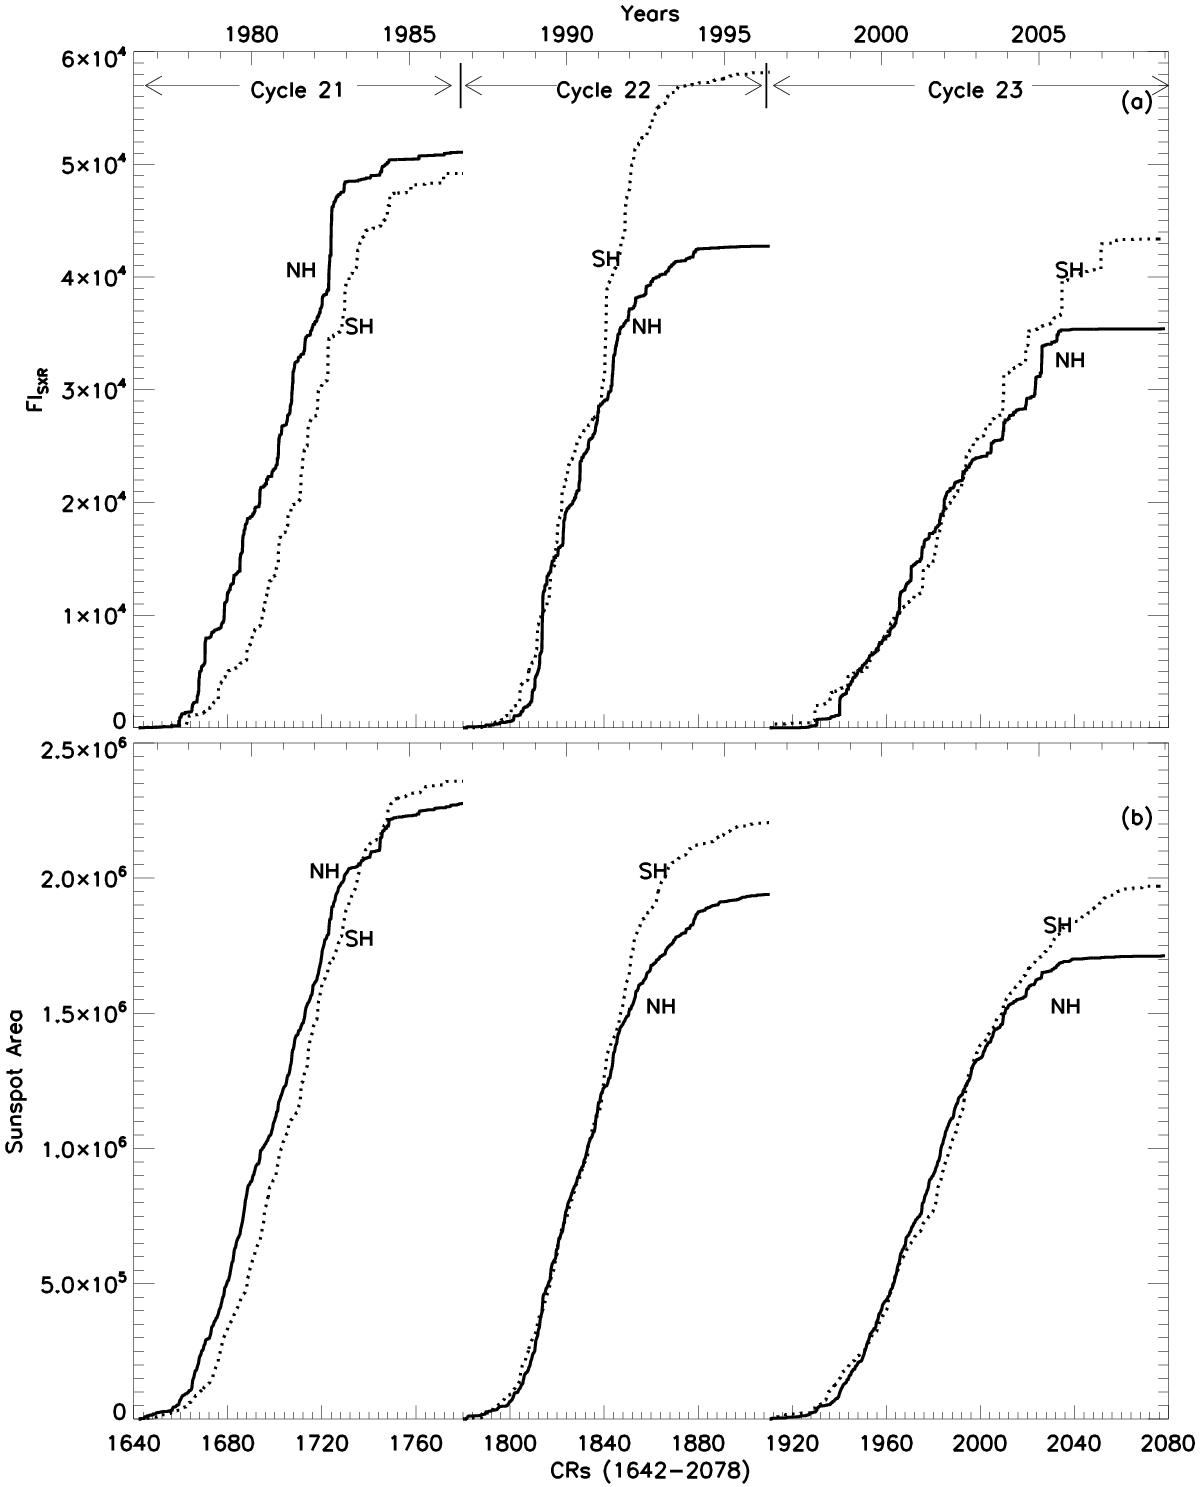
Cumulative values of FISXR (top panel) and sunspot area (bottom panel) for the northern (solid line) and the southern (dotted line) hemispheres during solar cycle 21, 22, and 23. In this representation, the vertical distance between the two curves (i.e., solid and dotted lines) at any time characterizes the north/south excess up to that epoch.
Current usage metrics show cumulative count of Article Views (full-text article views including HTML views, PDF and ePub downloads, according to the available data) and Abstracts Views on Vision4Press platform.
Data correspond to usage on the plateform after 2015. The current usage metrics is available 48-96 hours after online publication and is updated daily on week days.
Initial download of the metrics may take a while.