Fig. 1
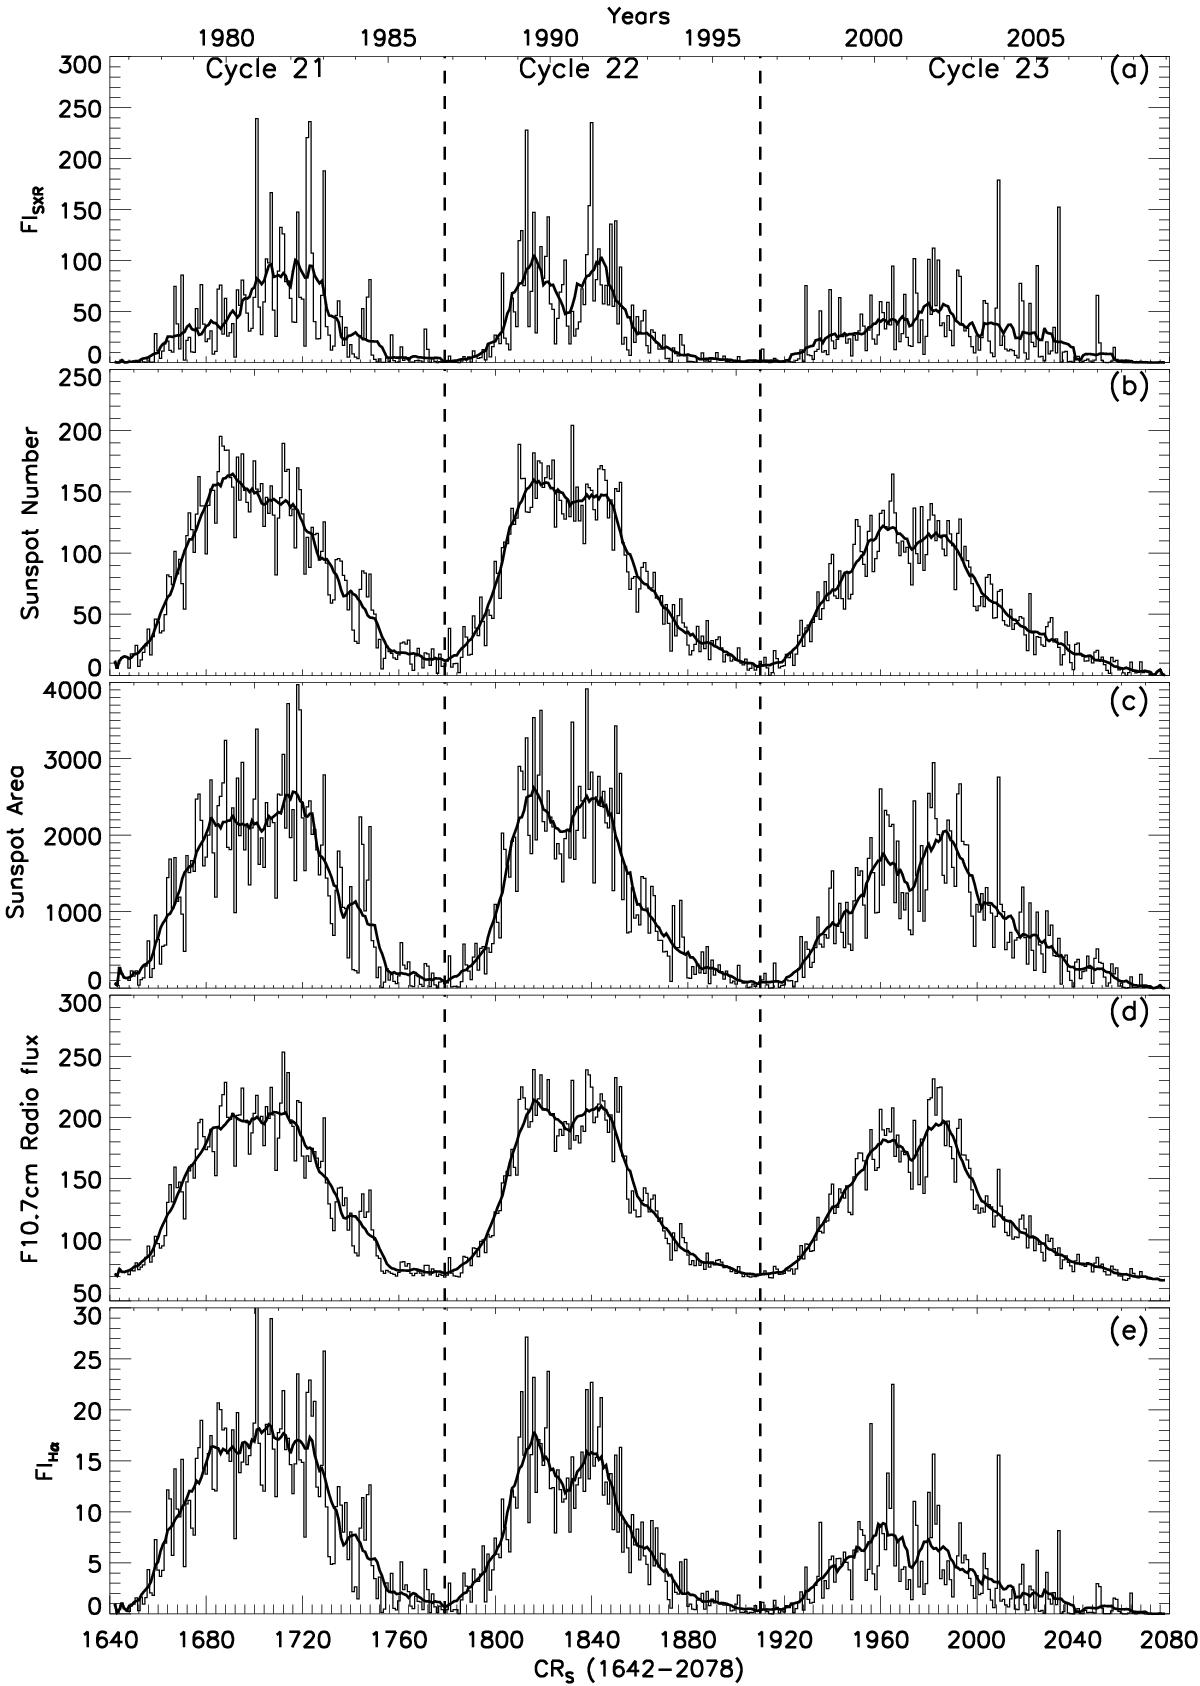
Temporal evolution of FISXR, sunspot number, sunspot area, F10.7, and FIHα (from top to bottom panels) during solar cycles 21, 22, and 23. Different plots represent values of corresponding solar activity parameter averaged over a Carrington rotation (CR). The X-axis is labeled in the units of Carrington rotation as well as calendar year. The vertical dashed lines indicate the minimum phase of solar cycles. The smoothed curve in each plot indicates the 13-point running averages.
Current usage metrics show cumulative count of Article Views (full-text article views including HTML views, PDF and ePub downloads, according to the available data) and Abstracts Views on Vision4Press platform.
Data correspond to usage on the plateform after 2015. The current usage metrics is available 48-96 hours after online publication and is updated daily on week days.
Initial download of the metrics may take a while.