Fig. 6
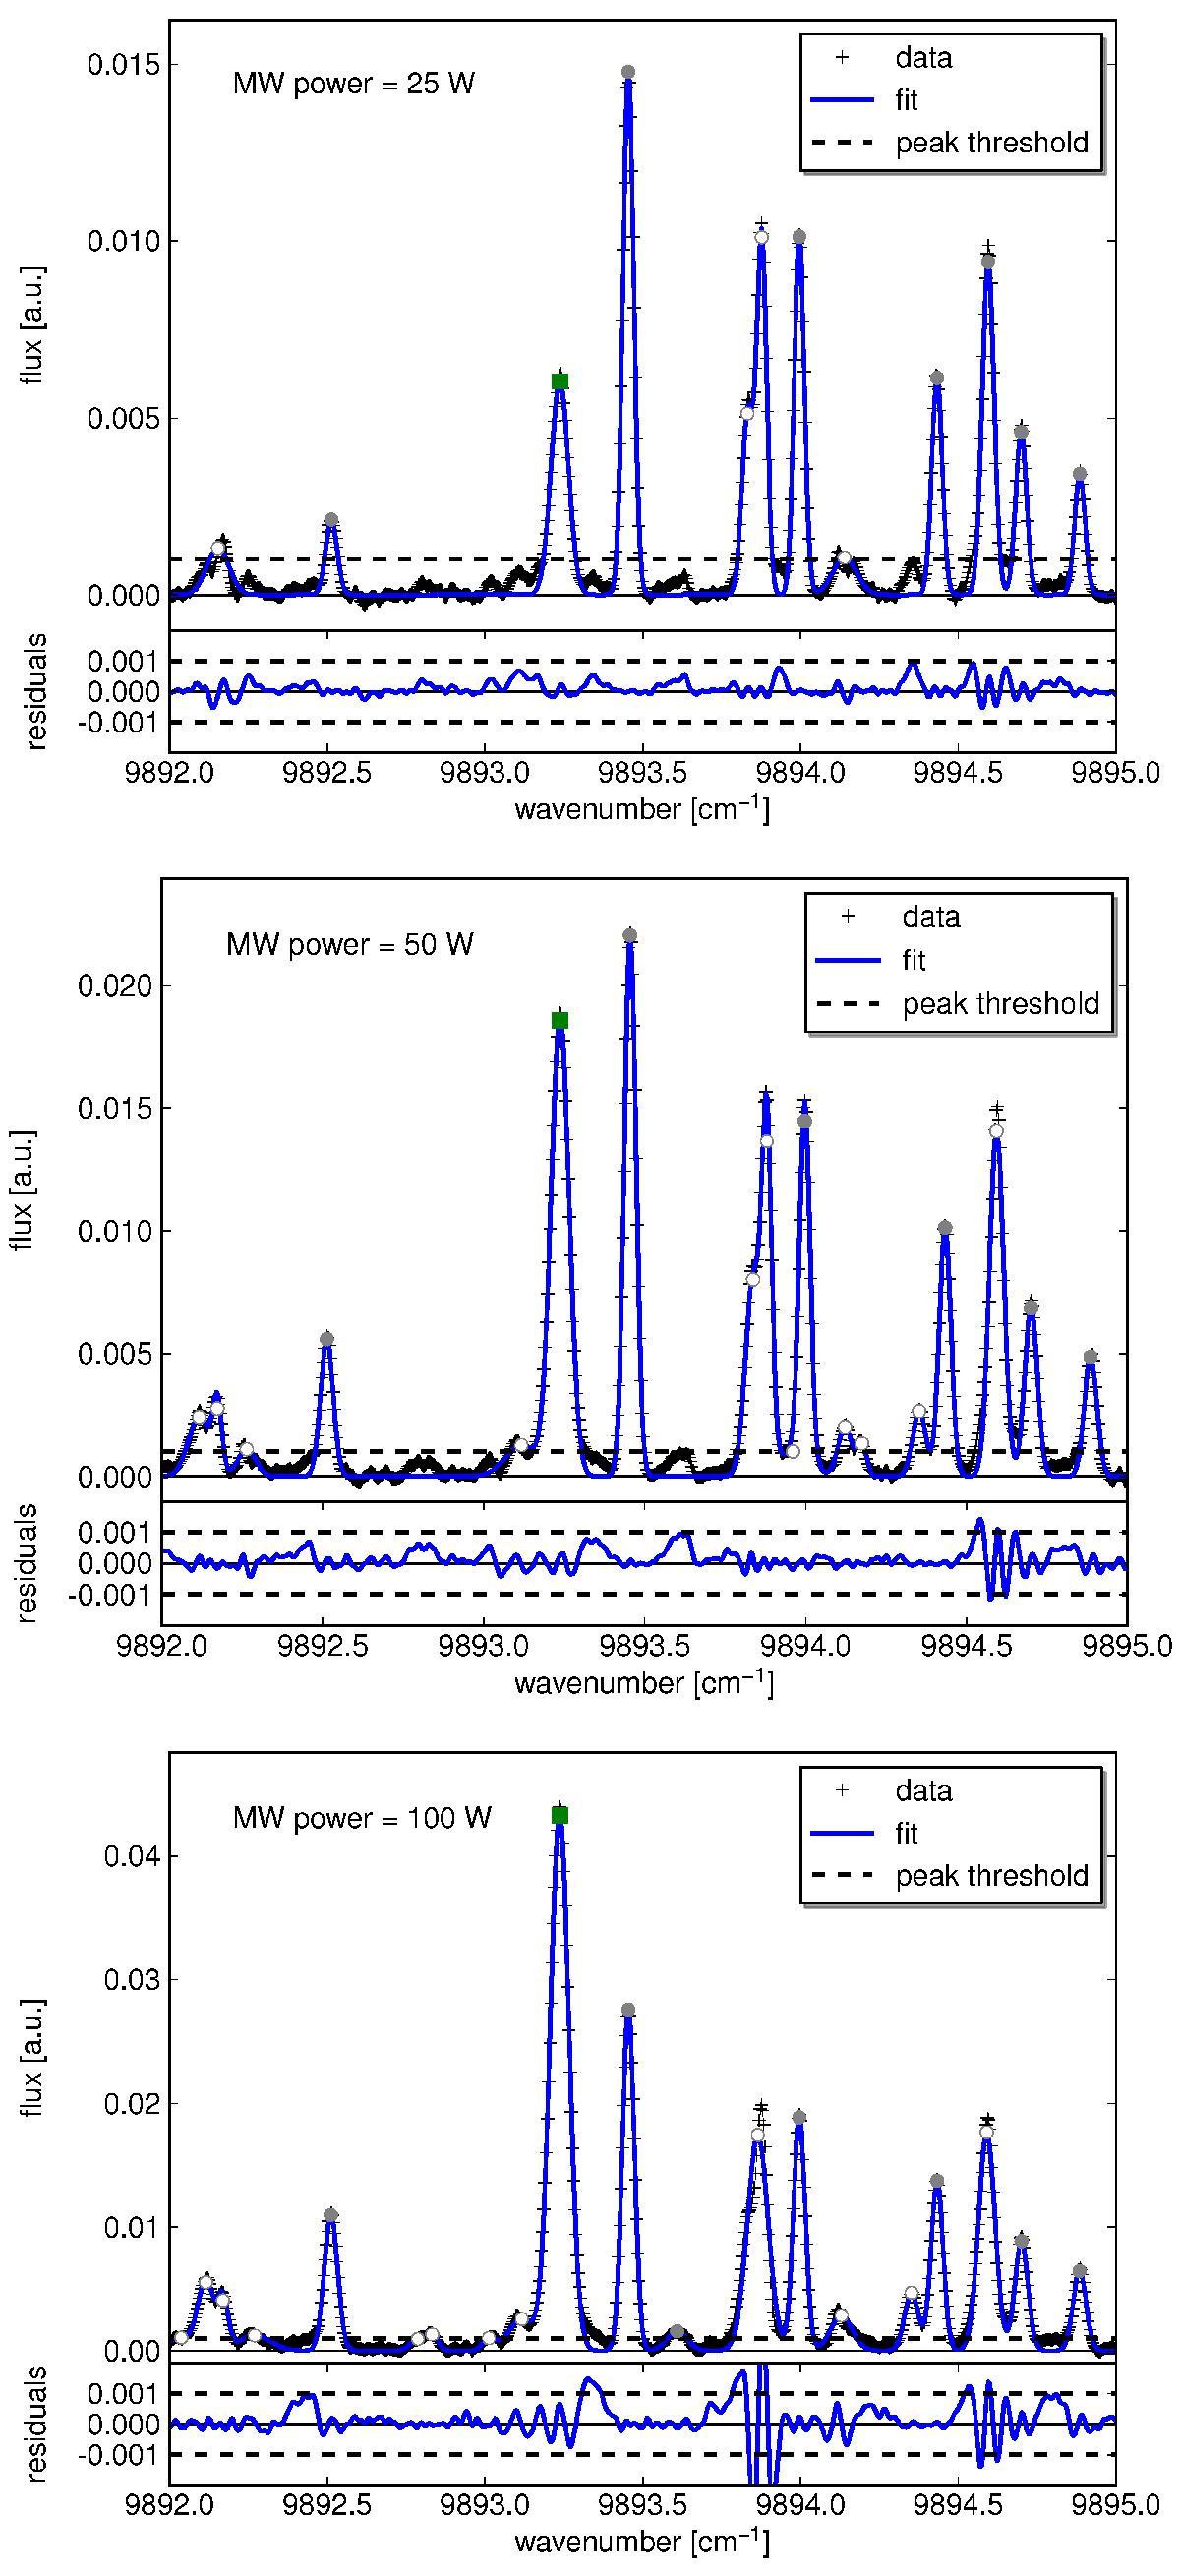
Recorded spectra between 9892 and 9895 cm-1. From top to bottom: discharge operated at MW power of 25, 50, and 100 W. The blue line is the fit composed of a superposition of Gauss profiles to the peaks exceeding the minimum peak intensity threshold (dashed horizontal line). A green square indicates an identified N I line, while a gray circle marks an unidentified line. See main text for more information (Sect. 3.8). Note that the ordinate axis is not the same scale for each plot.
Current usage metrics show cumulative count of Article Views (full-text article views including HTML views, PDF and ePub downloads, according to the available data) and Abstracts Views on Vision4Press platform.
Data correspond to usage on the plateform after 2015. The current usage metrics is available 48-96 hours after online publication and is updated daily on week days.
Initial download of the metrics may take a while.