Fig. 5
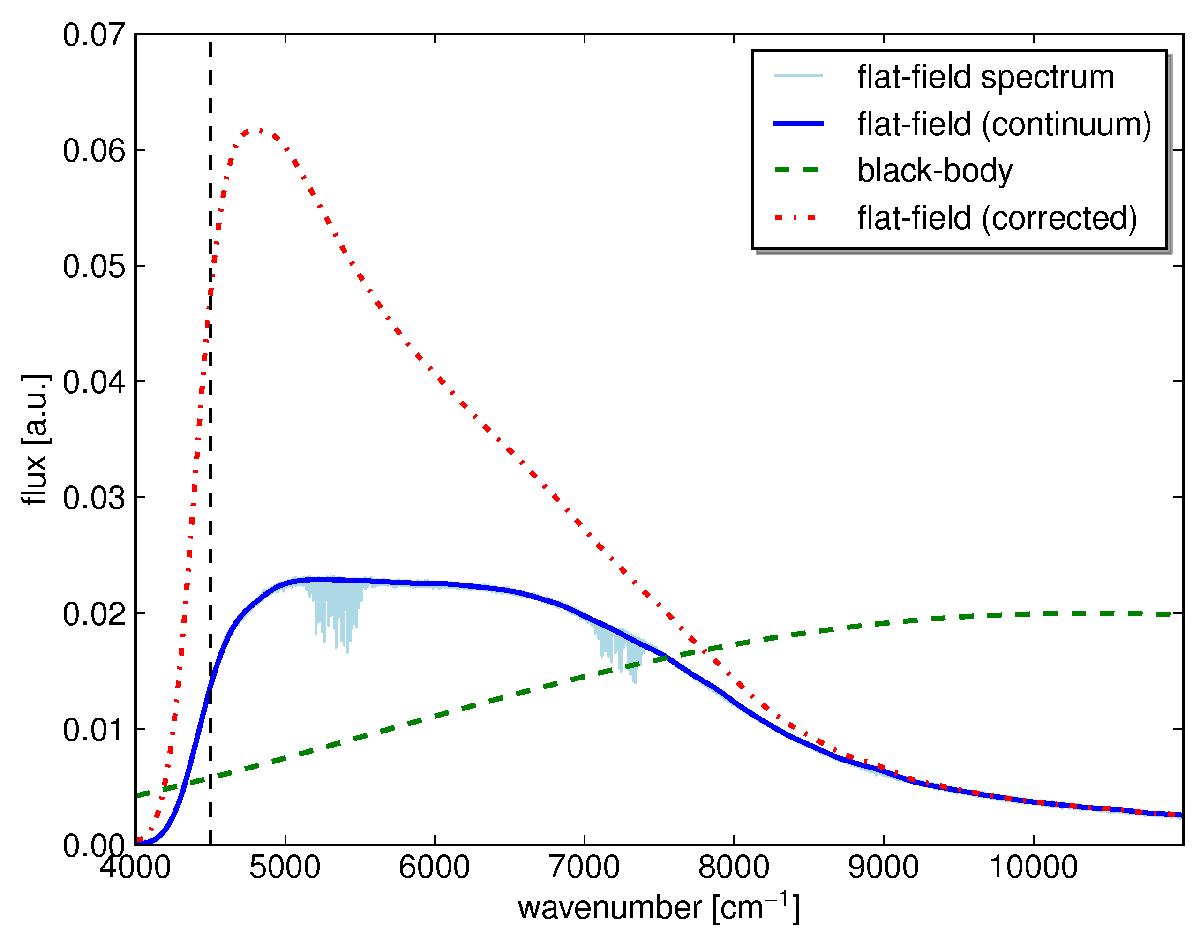
Spectrum of a halogen lamp used as a flat-field (spectrum shown in light blue with absorption bands from atmospheric water). The dark blue line describes the continuum of this spectrum. The green dashed curve shows the theoretical normalized curve of a blackbody at the halogen lamp’s bulb temperature of 3000 K (scaled by a factor of 1/50 for visualization). The red dot-dashed curve is the flat-field continuum divided by the theoretical normalized blackbody spectrum. The raw intensities of the spectral lines are corrected by the latter curve. The vertical dashed line indicates 4500 cm-1.
Current usage metrics show cumulative count of Article Views (full-text article views including HTML views, PDF and ePub downloads, according to the available data) and Abstracts Views on Vision4Press platform.
Data correspond to usage on the plateform after 2015. The current usage metrics is available 48-96 hours after online publication and is updated daily on week days.
Initial download of the metrics may take a while.