Free Access
Fig. 4
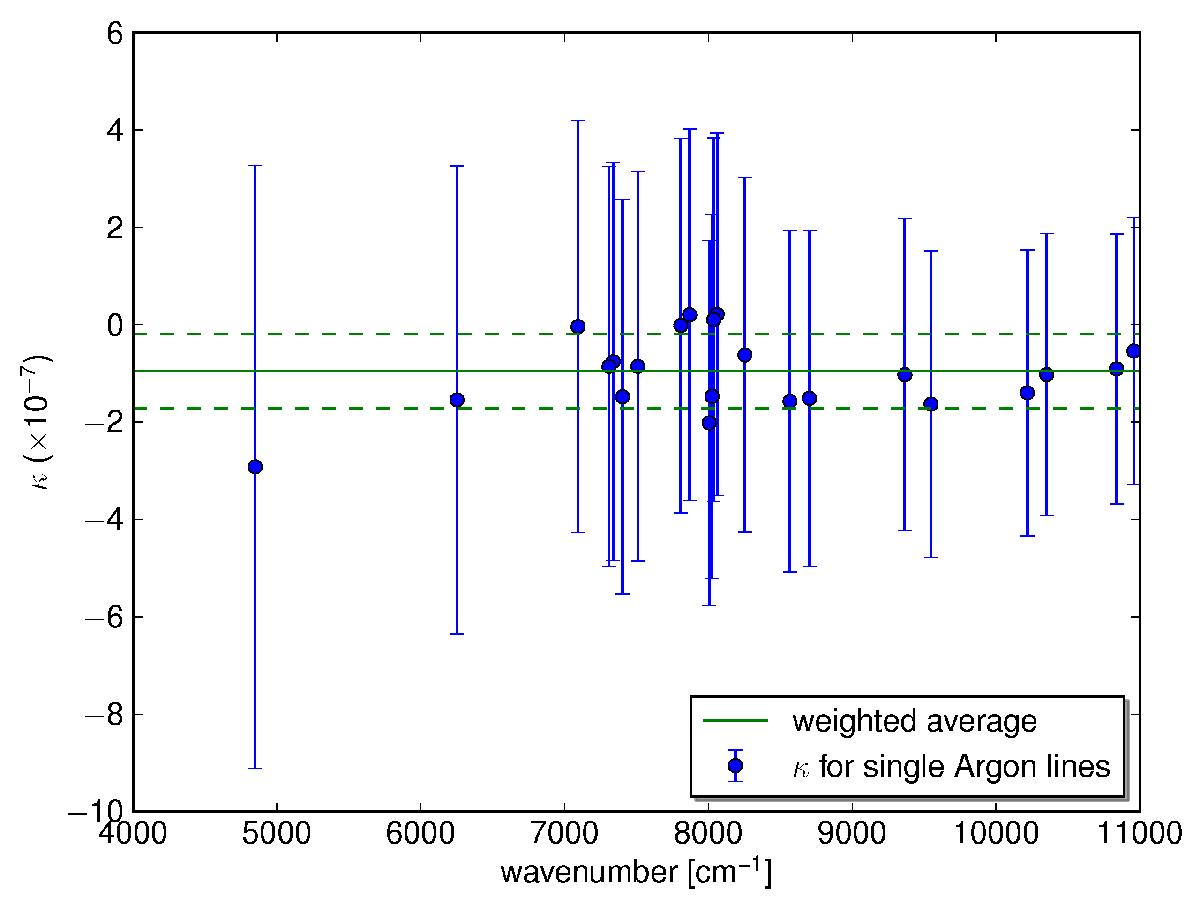
Correction factor κ for the absolute wavenumber scale of the FTS as determined for 22 atomic argon lines. The horizontal line indicates the weighted average (solid line) with its error margin (dashed lines). Shown are the data for the argon spectrum recorded before the measurements of the nitrogen spectra.
Current usage metrics show cumulative count of Article Views (full-text article views including HTML views, PDF and ePub downloads, according to the available data) and Abstracts Views on Vision4Press platform.
Data correspond to usage on the plateform after 2015. The current usage metrics is available 48-96 hours after online publication and is updated daily on week days.
Initial download of the metrics may take a while.