Fig. 2
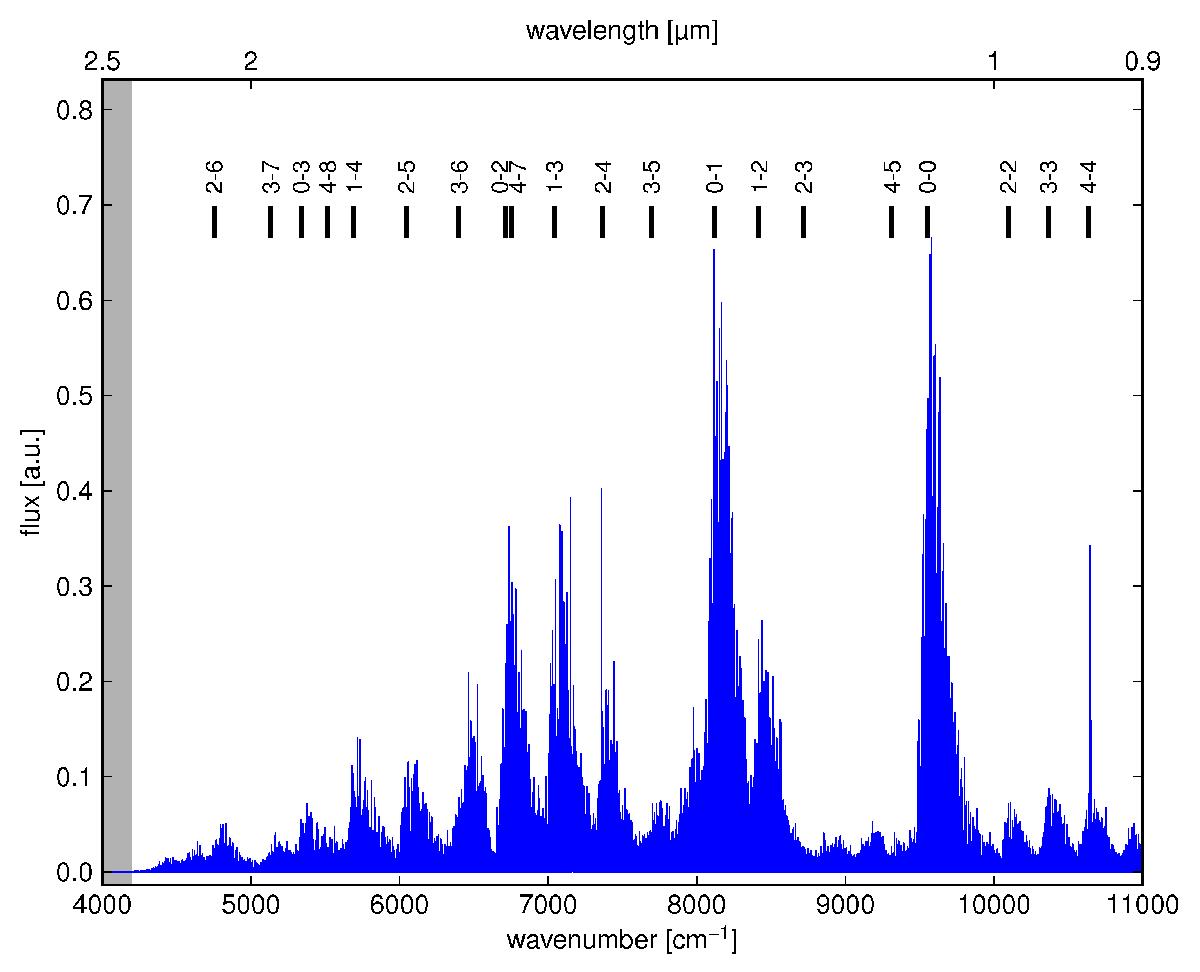
Raw emission spectrum of the nitrogen gas discharge operated at a MW power of 50 W. Strong vibrational bands from the First Positive System of 14N2 are labeled (v′−v′′) for orientation using band origin wavenumbers as given by Gilmore et al. (1992). The spectral range below 4200 cm-1 (gray box) does not contain any emission lines and was used to determine the absolute noise level in the spectrum.
Current usage metrics show cumulative count of Article Views (full-text article views including HTML views, PDF and ePub downloads, according to the available data) and Abstracts Views on Vision4Press platform.
Data correspond to usage on the plateform after 2015. The current usage metrics is available 48-96 hours after online publication and is updated daily on week days.
Initial download of the metrics may take a while.