Free Access
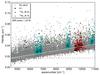
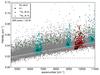
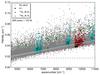
Fig. 11

Each point represents the FWHMc of one spectral line as a function of wavenumber. The solid lines show linear regressions with ordinate crossing forced at the origin. The black dashed horizontal line indicates the FTS resolution. From top to bottom: discharge operated at microwave power of 25, 50, and 100 W.
This figure is made of several images, please see below:
Current usage metrics show cumulative count of Article Views (full-text article views including HTML views, PDF and ePub downloads, according to the available data) and Abstracts Views on Vision4Press platform.
Data correspond to usage on the plateform after 2015. The current usage metrics is available 48-96 hours after online publication and is updated daily on week days.
Initial download of the metrics may take a while.