Fig. 10
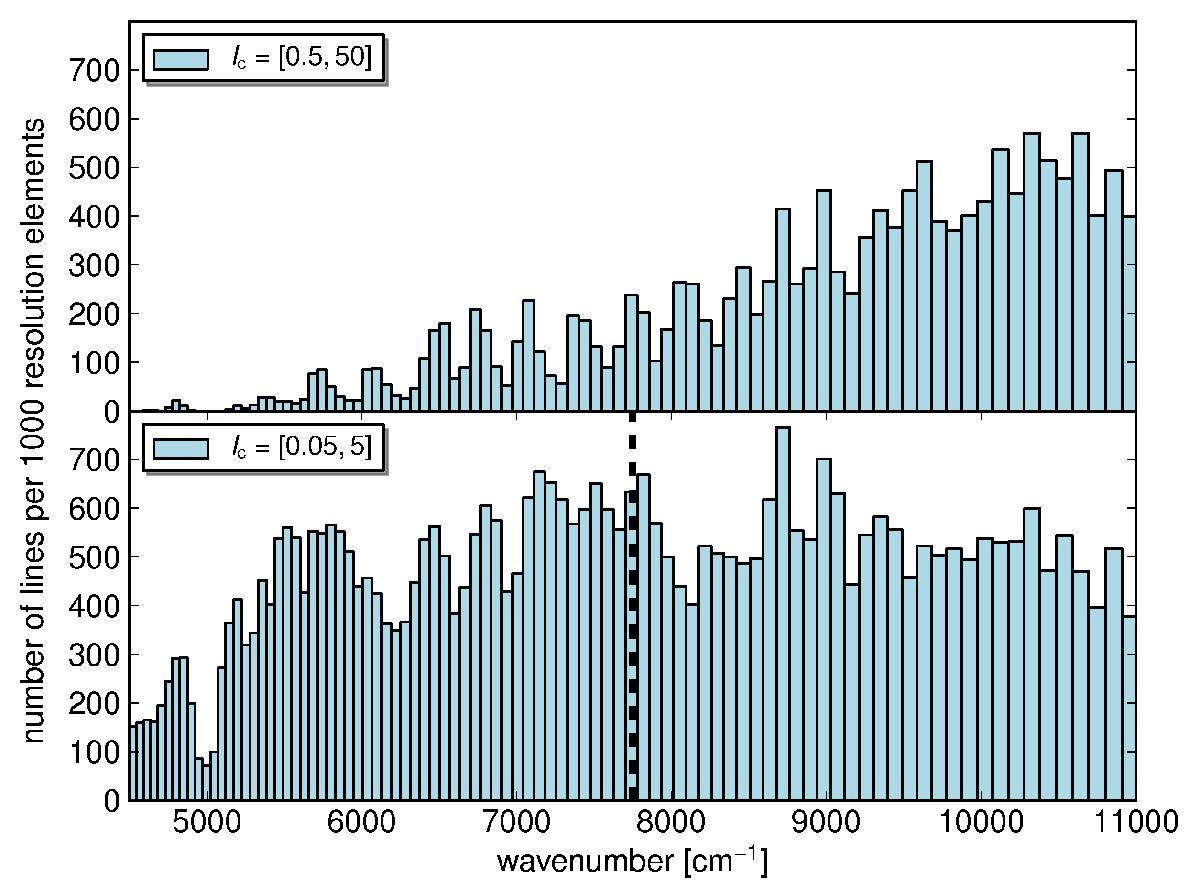
Histograms of detected emission lines as a function of wavenumber. The samples are limited to emission lines with a peak intensity 0.5−50 (upper panel) and 0.05−5 (lower panel). Each bin covers 1000 resolution elements based on a resolution of R = 100 000. In the lower panel, the dashed vertical line is located at 7750 cm-1 and the sample is expected to be incomplete at higher wavenumbers (compare with Fig. 7). Data from discharge operated at MW power of 50 W.
Current usage metrics show cumulative count of Article Views (full-text article views including HTML views, PDF and ePub downloads, according to the available data) and Abstracts Views on Vision4Press platform.
Data correspond to usage on the plateform after 2015. The current usage metrics is available 48-96 hours after online publication and is updated daily on week days.
Initial download of the metrics may take a while.