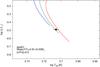
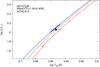
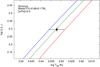
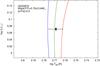
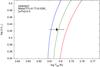
Fig. A.1
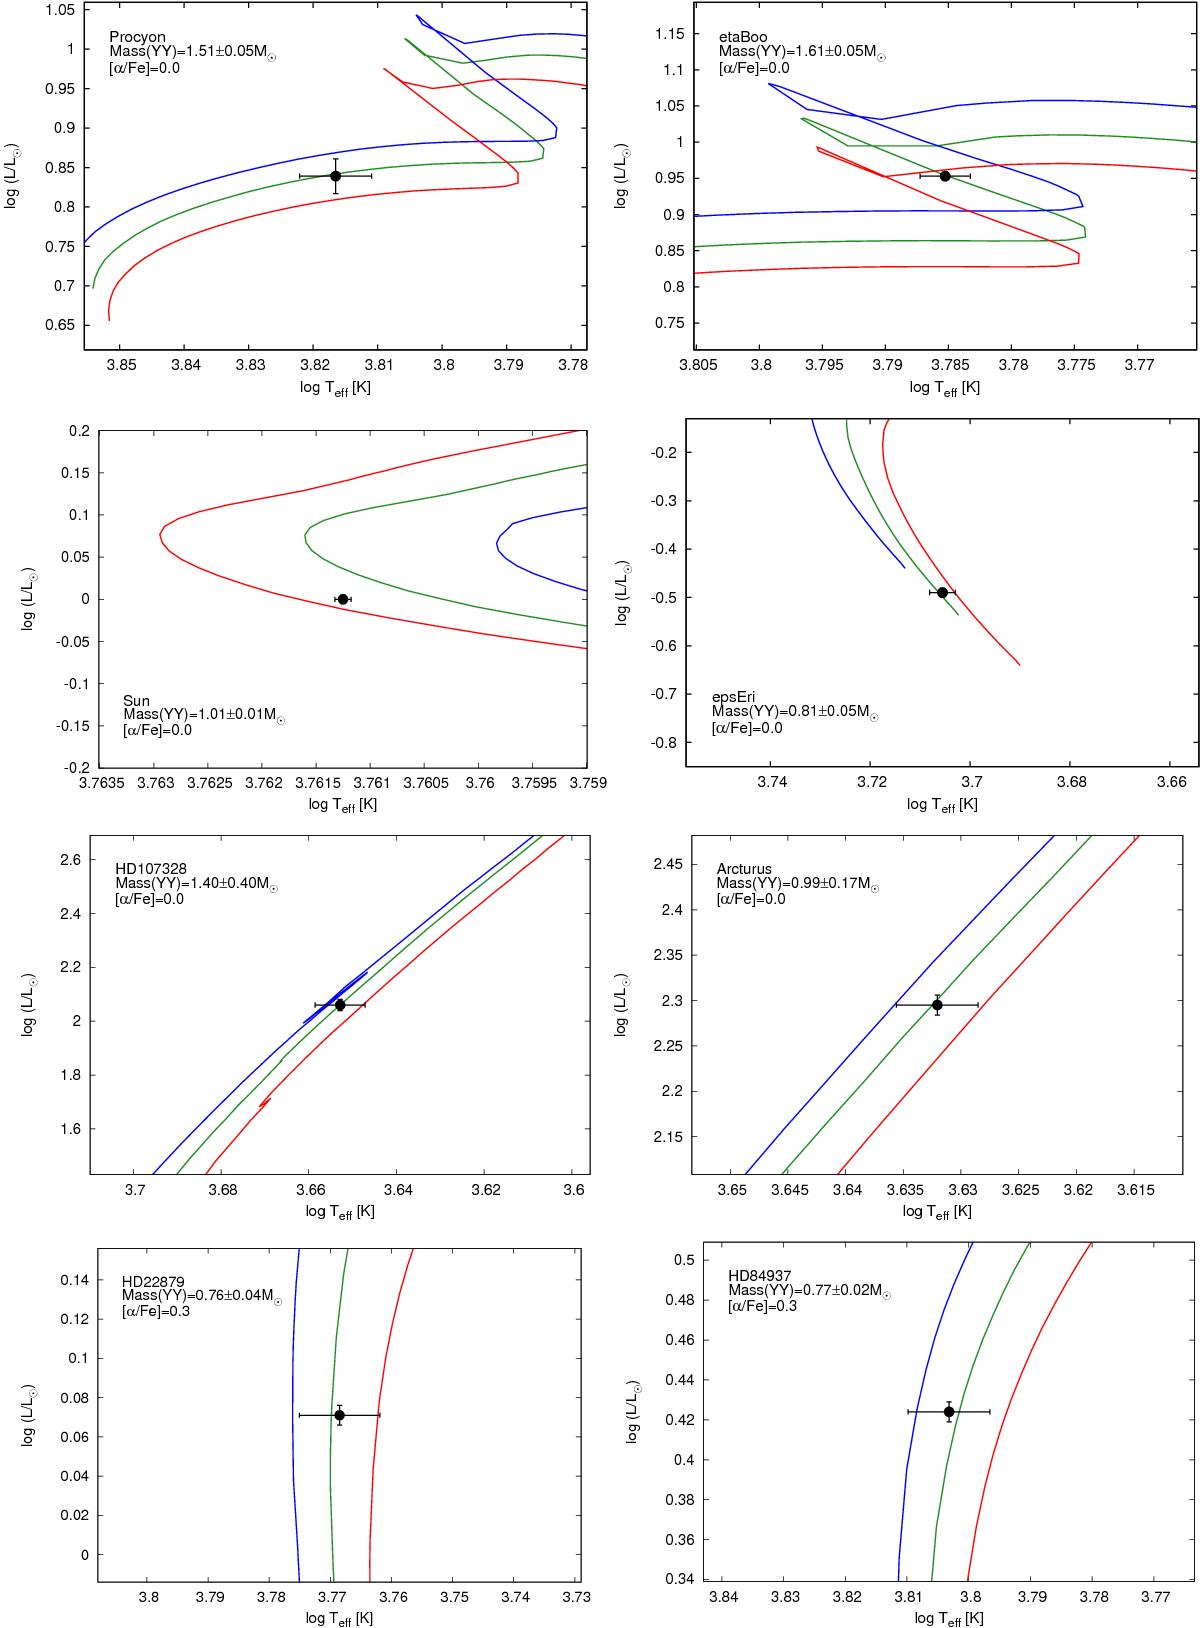
Evolutionary tracks for selected Gaia FGK benchmark stars, interpolated in the Yonsei-Yale grid for three different combinations of mass (given in each panel) and metallicity (taken from Table 1), see text for meaning of line colours. Metallicities decrease from top to bottom. Effective temperature and luminosity determined in this paper are indicated by the black filled circles. The α-element abundances [α/Fe] of the grids are indicated as well.
Current usage metrics show cumulative count of Article Views (full-text article views including HTML views, PDF and ePub downloads, according to the available data) and Abstracts Views on Vision4Press platform.
Data correspond to usage on the plateform after 2015. The current usage metrics is available 48-96 hours after online publication and is updated daily on week days.
Initial download of the metrics may take a while.