Fig. 11
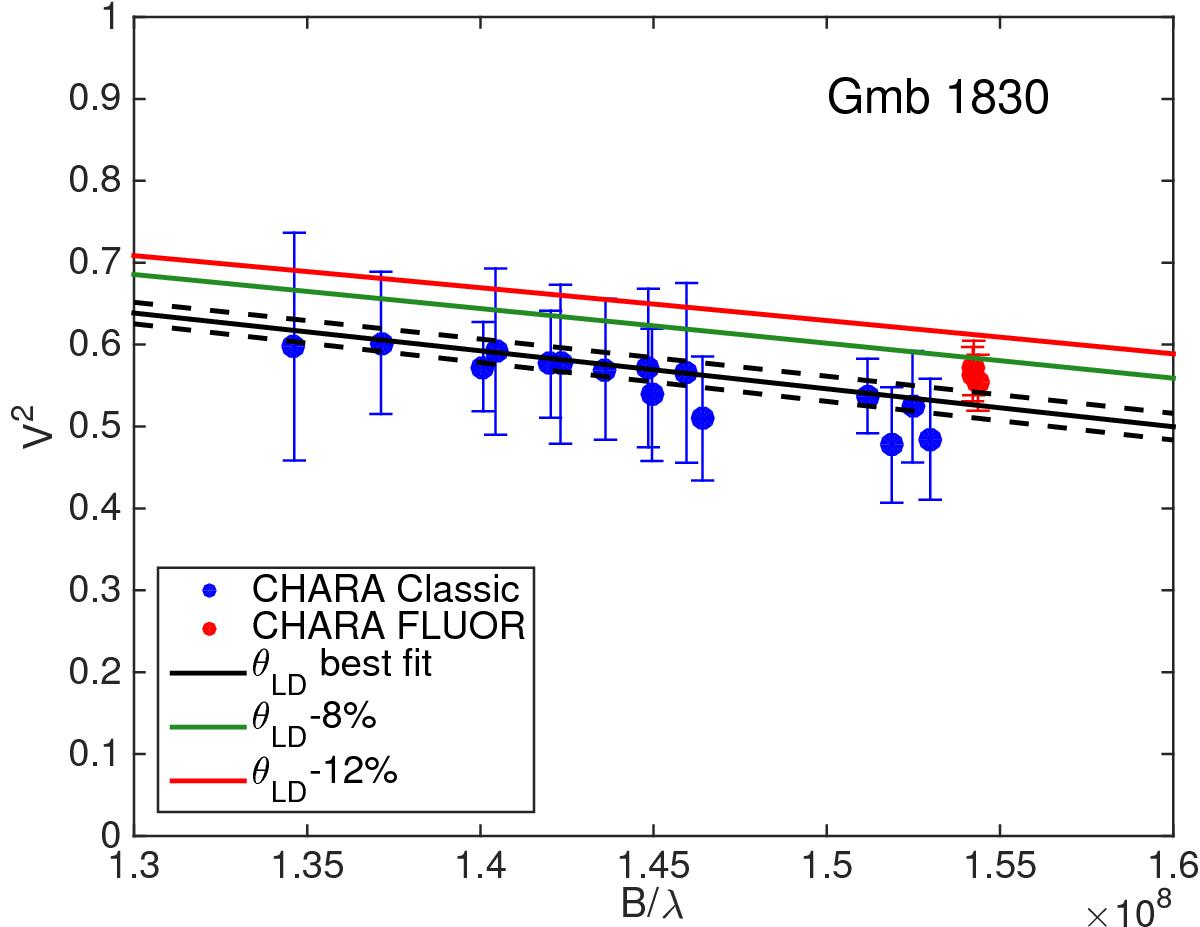
Squared visibility measurements for Gmb 1830 from two instruments at the CHARA array (Creevey et al. 2012, their Table 2) compared to model visibility curves including limb darkening and assuming the best-fit angular diameter (black solid line) and its formal uncertainty (black dashed lines), as well as angular diameters that were decreased by 8 and 12% (green and red solid lines, respectively).
Current usage metrics show cumulative count of Article Views (full-text article views including HTML views, PDF and ePub downloads, according to the available data) and Abstracts Views on Vision4Press platform.
Data correspond to usage on the plateform after 2015. The current usage metrics is available 48-96 hours after online publication and is updated daily on week days.
Initial download of the metrics may take a while.