Fig. 10
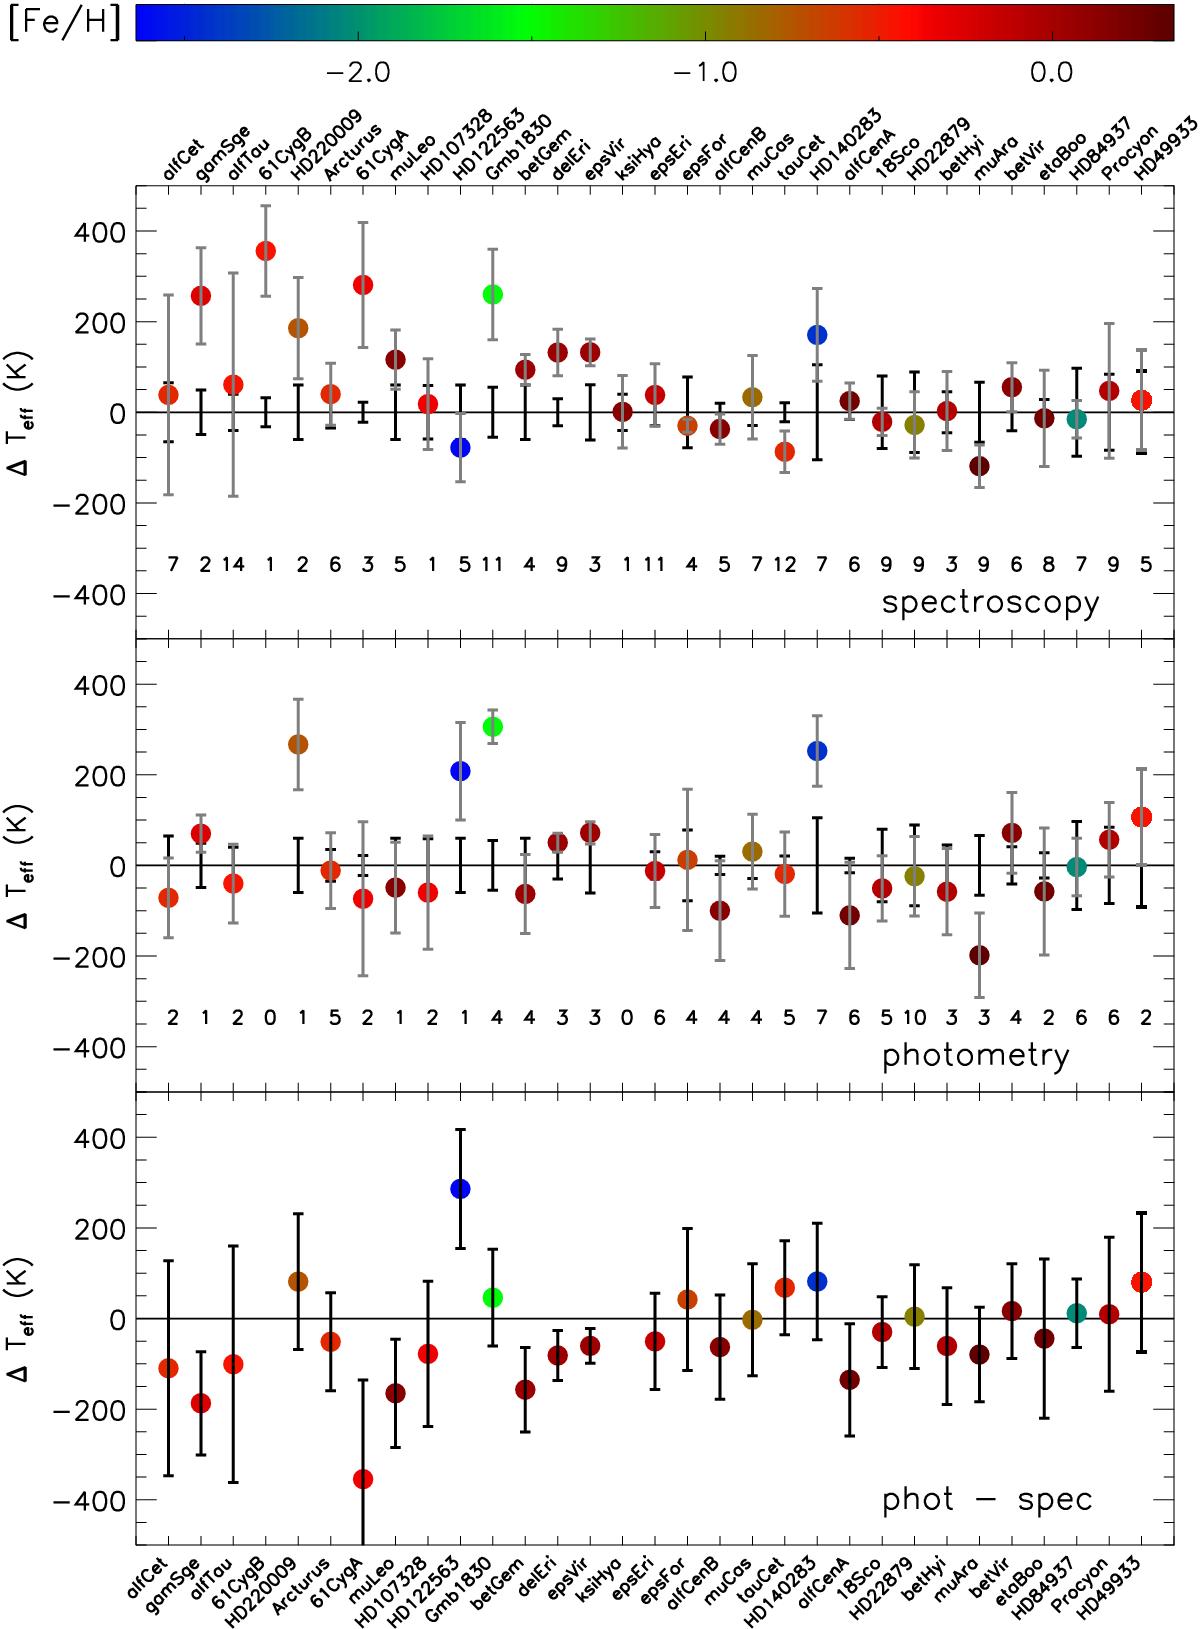
Comparison of the fundamental temperature values with mean values of spectroscopic and photometric determinations compiled from the literature. The stars are ordered by increasing fundamental temperature from left to right. The two upper panels display the difference in the literature Teff from the fundamental Teff. Black error bars centred on zero represent the uncertainty in fundamental Teff for each star, while grey error bars represent the standard deviation of the mean for N ≥ 3, and combined and individual uncertainties in the case of two and one determinations, respectively. The number of determinations for each star are indicated in the two panels. The bottom panel compares the photometric and spectroscopic temperature measurements with error bars representing combined standard deviations. Symbol colour indicates metallicity from Table 1. See text and Table 11 for data, references, and discussion.
Current usage metrics show cumulative count of Article Views (full-text article views including HTML views, PDF and ePub downloads, according to the available data) and Abstracts Views on Vision4Press platform.
Data correspond to usage on the plateform after 2015. The current usage metrics is available 48-96 hours after online publication and is updated daily on week days.
Initial download of the metrics may take a while.