Fig. 8
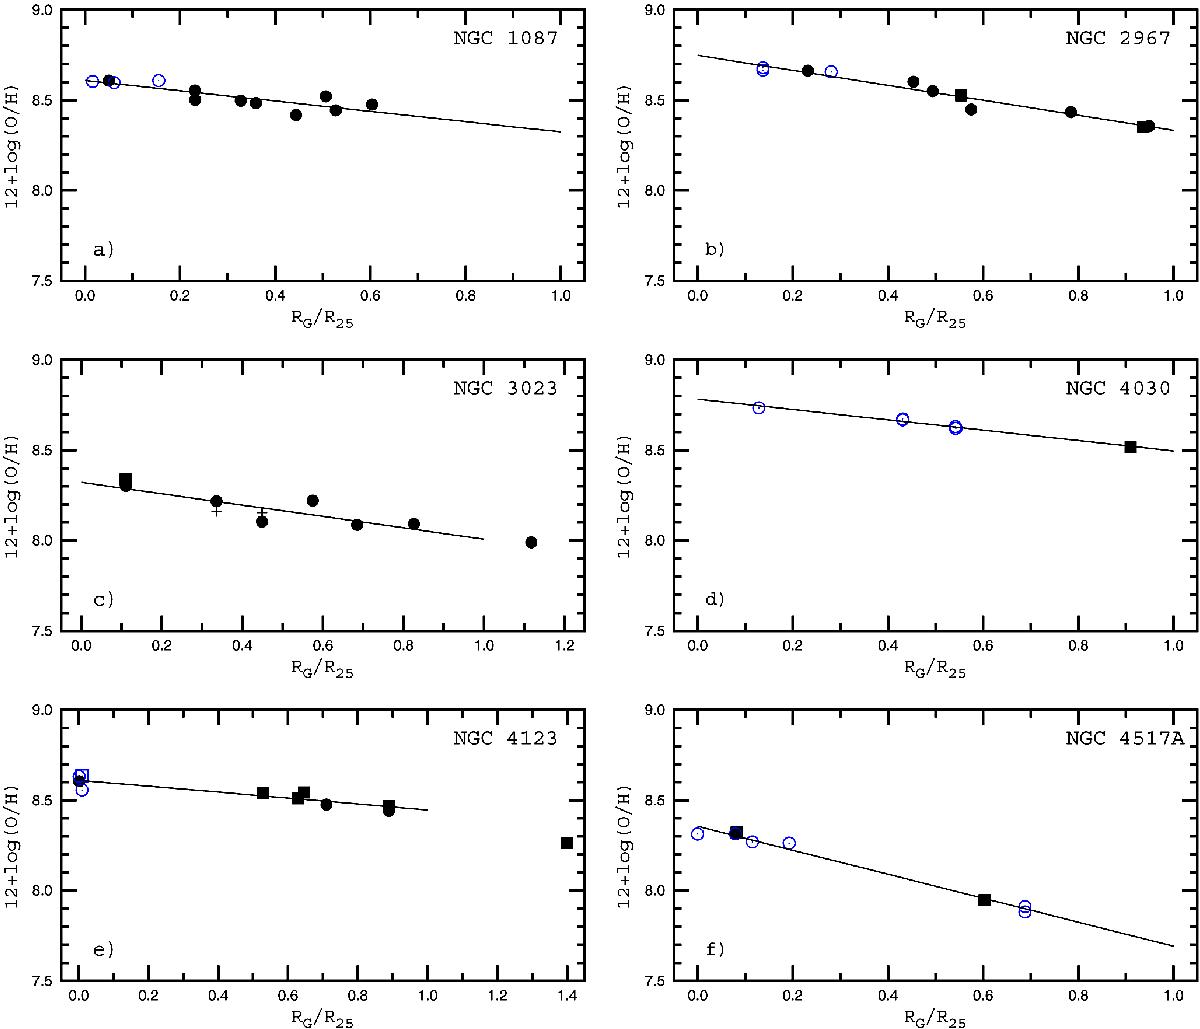
Radial distributions of oxygen abundances in the disks of our target galaxies. The plus signs are abundances derived through the Te method, the circles are abundances obtained through the CNS method, and the squares are those inferred through the CON method. The filled symbols show abundances based on our SALT spectra, the open (blue) symbols are abundances based on spectra from the literature (see text). The solid line in each panel is the best linear fit to the data points with galactocentric distances less than the isophotal R25 radius. (A color version of this figure is available in the online version.)
Current usage metrics show cumulative count of Article Views (full-text article views including HTML views, PDF and ePub downloads, according to the available data) and Abstracts Views on Vision4Press platform.
Data correspond to usage on the plateform after 2015. The current usage metrics is available 48-96 hours after online publication and is updated daily on week days.
Initial download of the metrics may take a while.