Fig. 7
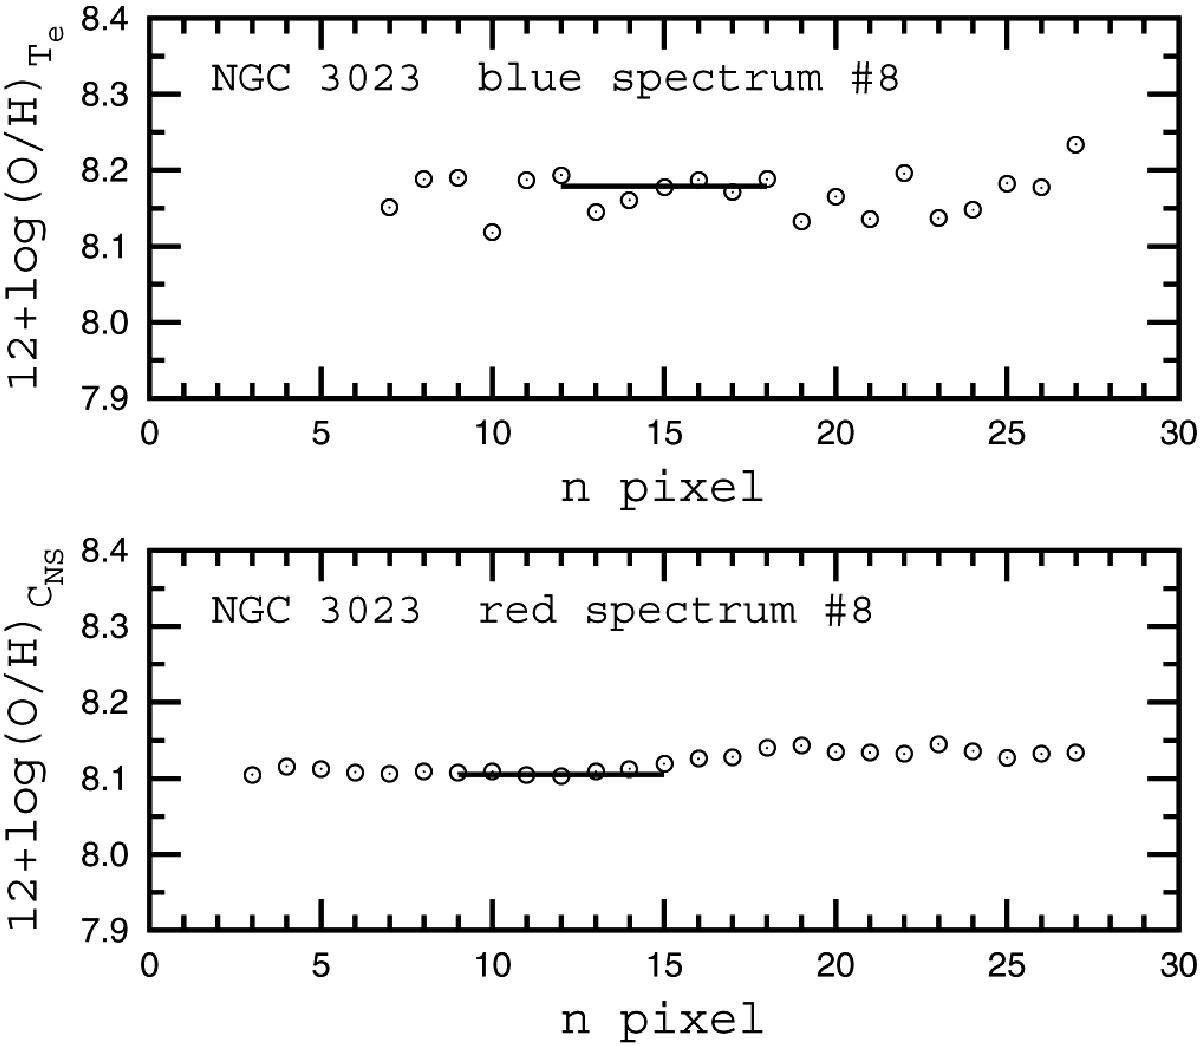
Oxygen abundances along the slit for the slit 8 in the NGC 3023. The circles in the upper panel show the oxygen abundances determined from the individual blue one-pixel-width spectra through the Te method. The solid line is the abundance obtained from the integrated seven-pixel-width spectrum through the Te method. The circles in the lower panel show the oxygen abundances determined from the individual red one-pixel-width spectra through the CNS method. The solid line is the abundance obtained from the integrated seven-pixel-width spectrum through the CNS method.
Current usage metrics show cumulative count of Article Views (full-text article views including HTML views, PDF and ePub downloads, according to the available data) and Abstracts Views on Vision4Press platform.
Data correspond to usage on the plateform after 2015. The current usage metrics is available 48-96 hours after online publication and is updated daily on week days.
Initial download of the metrics may take a while.