Fig. 6
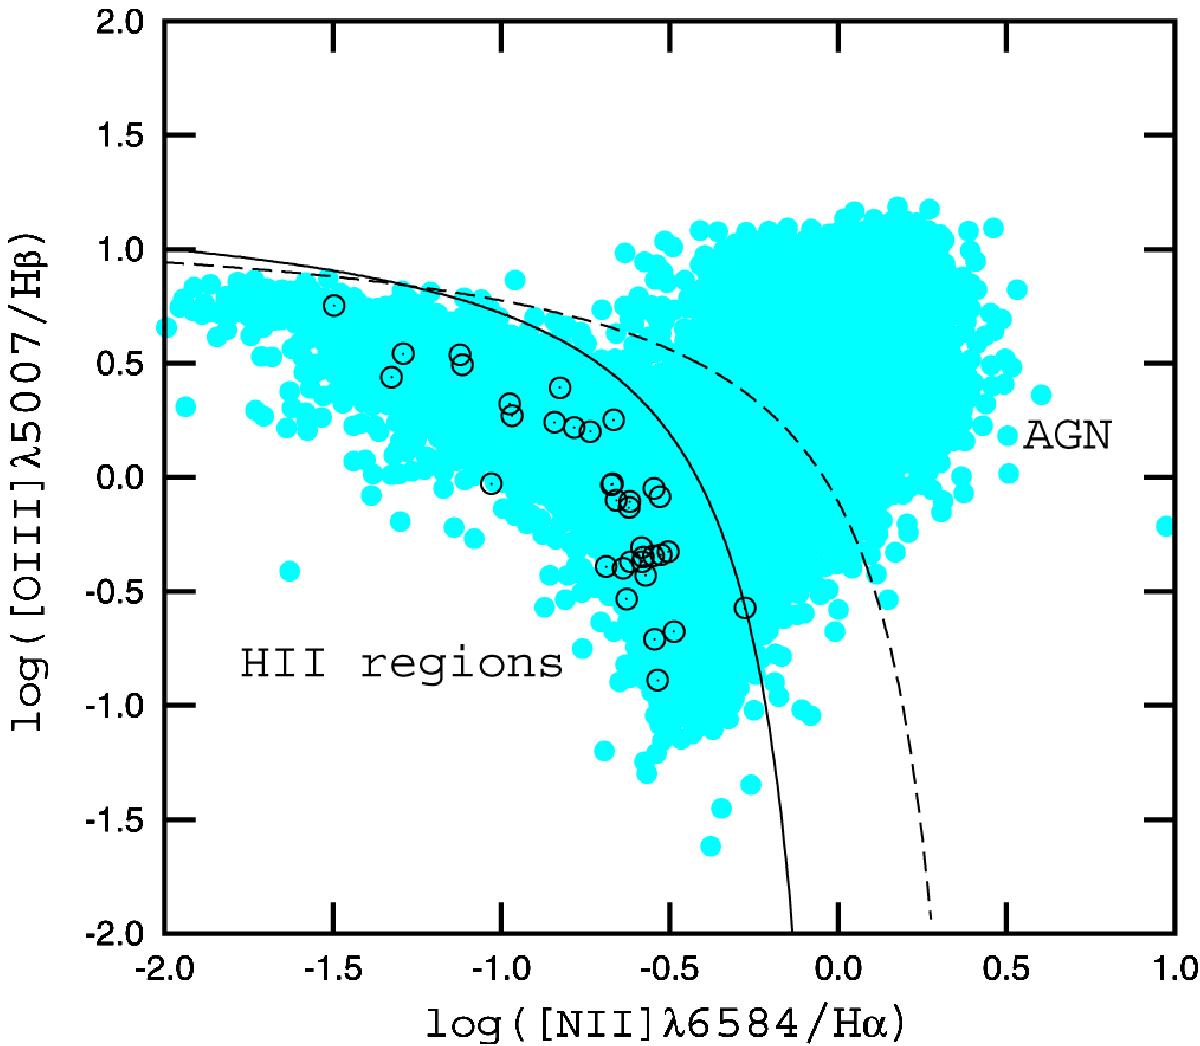
Diagram of [N ii]λ6584/Hα versus [O iii]λ5007/Hβ . The symbols denote results for the measured H ii regions in our target galaxies. The solid line separates objects with H ii region spectra from those containing an AGN according to Kauffmann et al. (2003), while the dashed line represents the same separation according to the work by Kewley et al. (2001). The gray (light blue) filled circles show a large sample of emission-line SDSS galaxies from Thuan et al. (2010).
Current usage metrics show cumulative count of Article Views (full-text article views including HTML views, PDF and ePub downloads, according to the available data) and Abstracts Views on Vision4Press platform.
Data correspond to usage on the plateform after 2015. The current usage metrics is available 48-96 hours after online publication and is updated daily on week days.
Initial download of the metrics may take a while.