Fig. 5
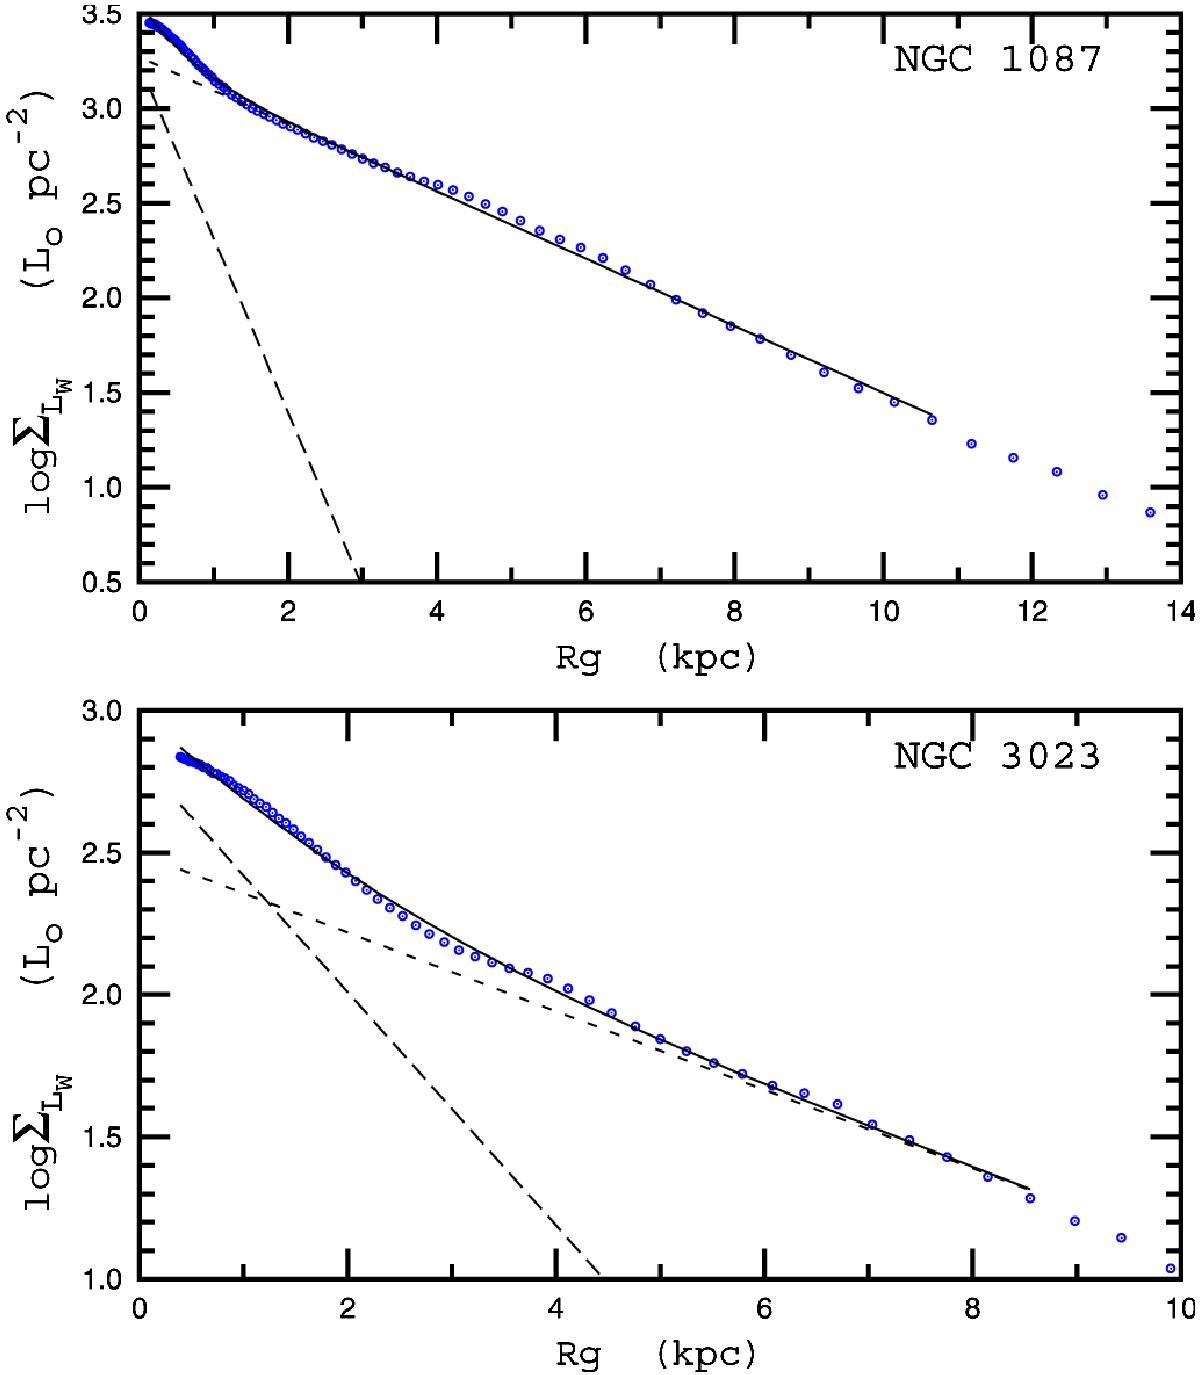
Patterns resulting from the bulge-disk decomposition of our target galaxies (X-axis: galactocentric radius in kpc, Y-axis: logarithm of the central surface brightness for a face-on galaxy orientation in solar luminosities per pc2). Each panel shows the decomposition assuming a purely exponential profile for the disk. The measured surface profile is plotted using gray (blue) circles. The bulge contribution is shown with a dotted line, the disk contribution with a dashed line, and the total (bulge + disk) fit with a solid line.
Current usage metrics show cumulative count of Article Views (full-text article views including HTML views, PDF and ePub downloads, according to the available data) and Abstracts Views on Vision4Press platform.
Data correspond to usage on the plateform after 2015. The current usage metrics is available 48-96 hours after online publication and is updated daily on week days.
Initial download of the metrics may take a while.