Fig. 11
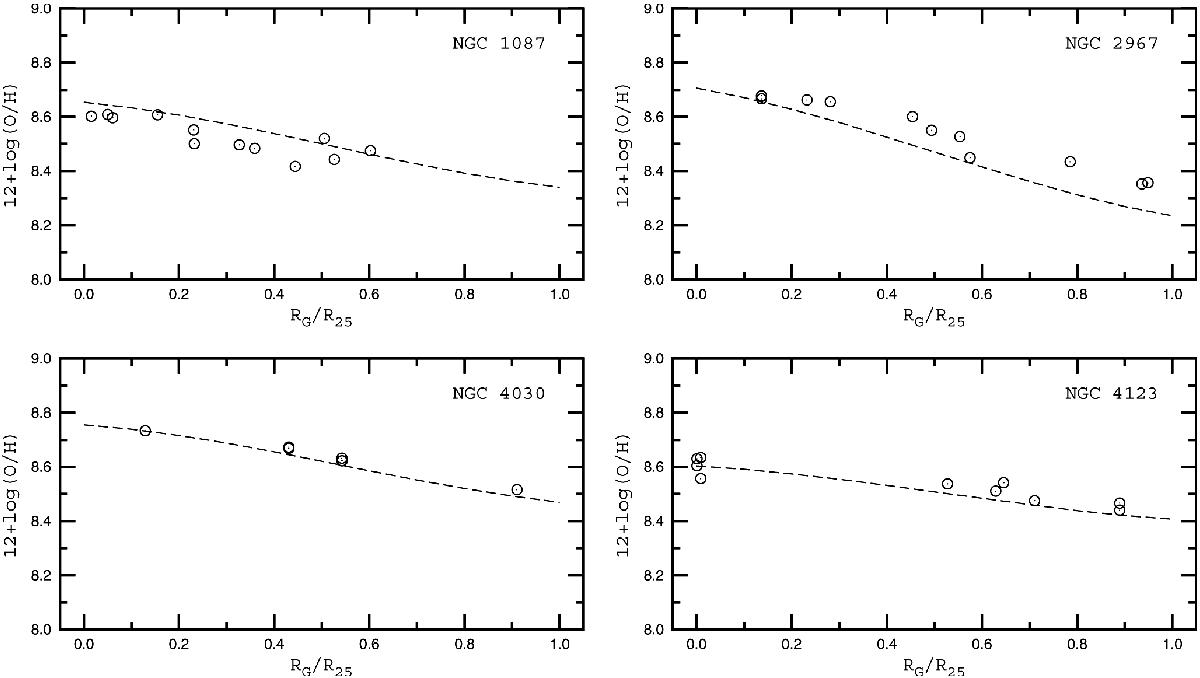
Radial distributions of oxygen abundances in the disks of the spiral galaxies of our sample. The circles represent the abundances of the individual H ii regions (the same as in Fig. 8). The line in each panel shows the abundance distribution predicted by the relation between abundance and surface brightness in the W1 band, Eq. (12).
Current usage metrics show cumulative count of Article Views (full-text article views including HTML views, PDF and ePub downloads, according to the available data) and Abstracts Views on Vision4Press platform.
Data correspond to usage on the plateform after 2015. The current usage metrics is available 48-96 hours after online publication and is updated daily on week days.
Initial download of the metrics may take a while.