Fig. 10
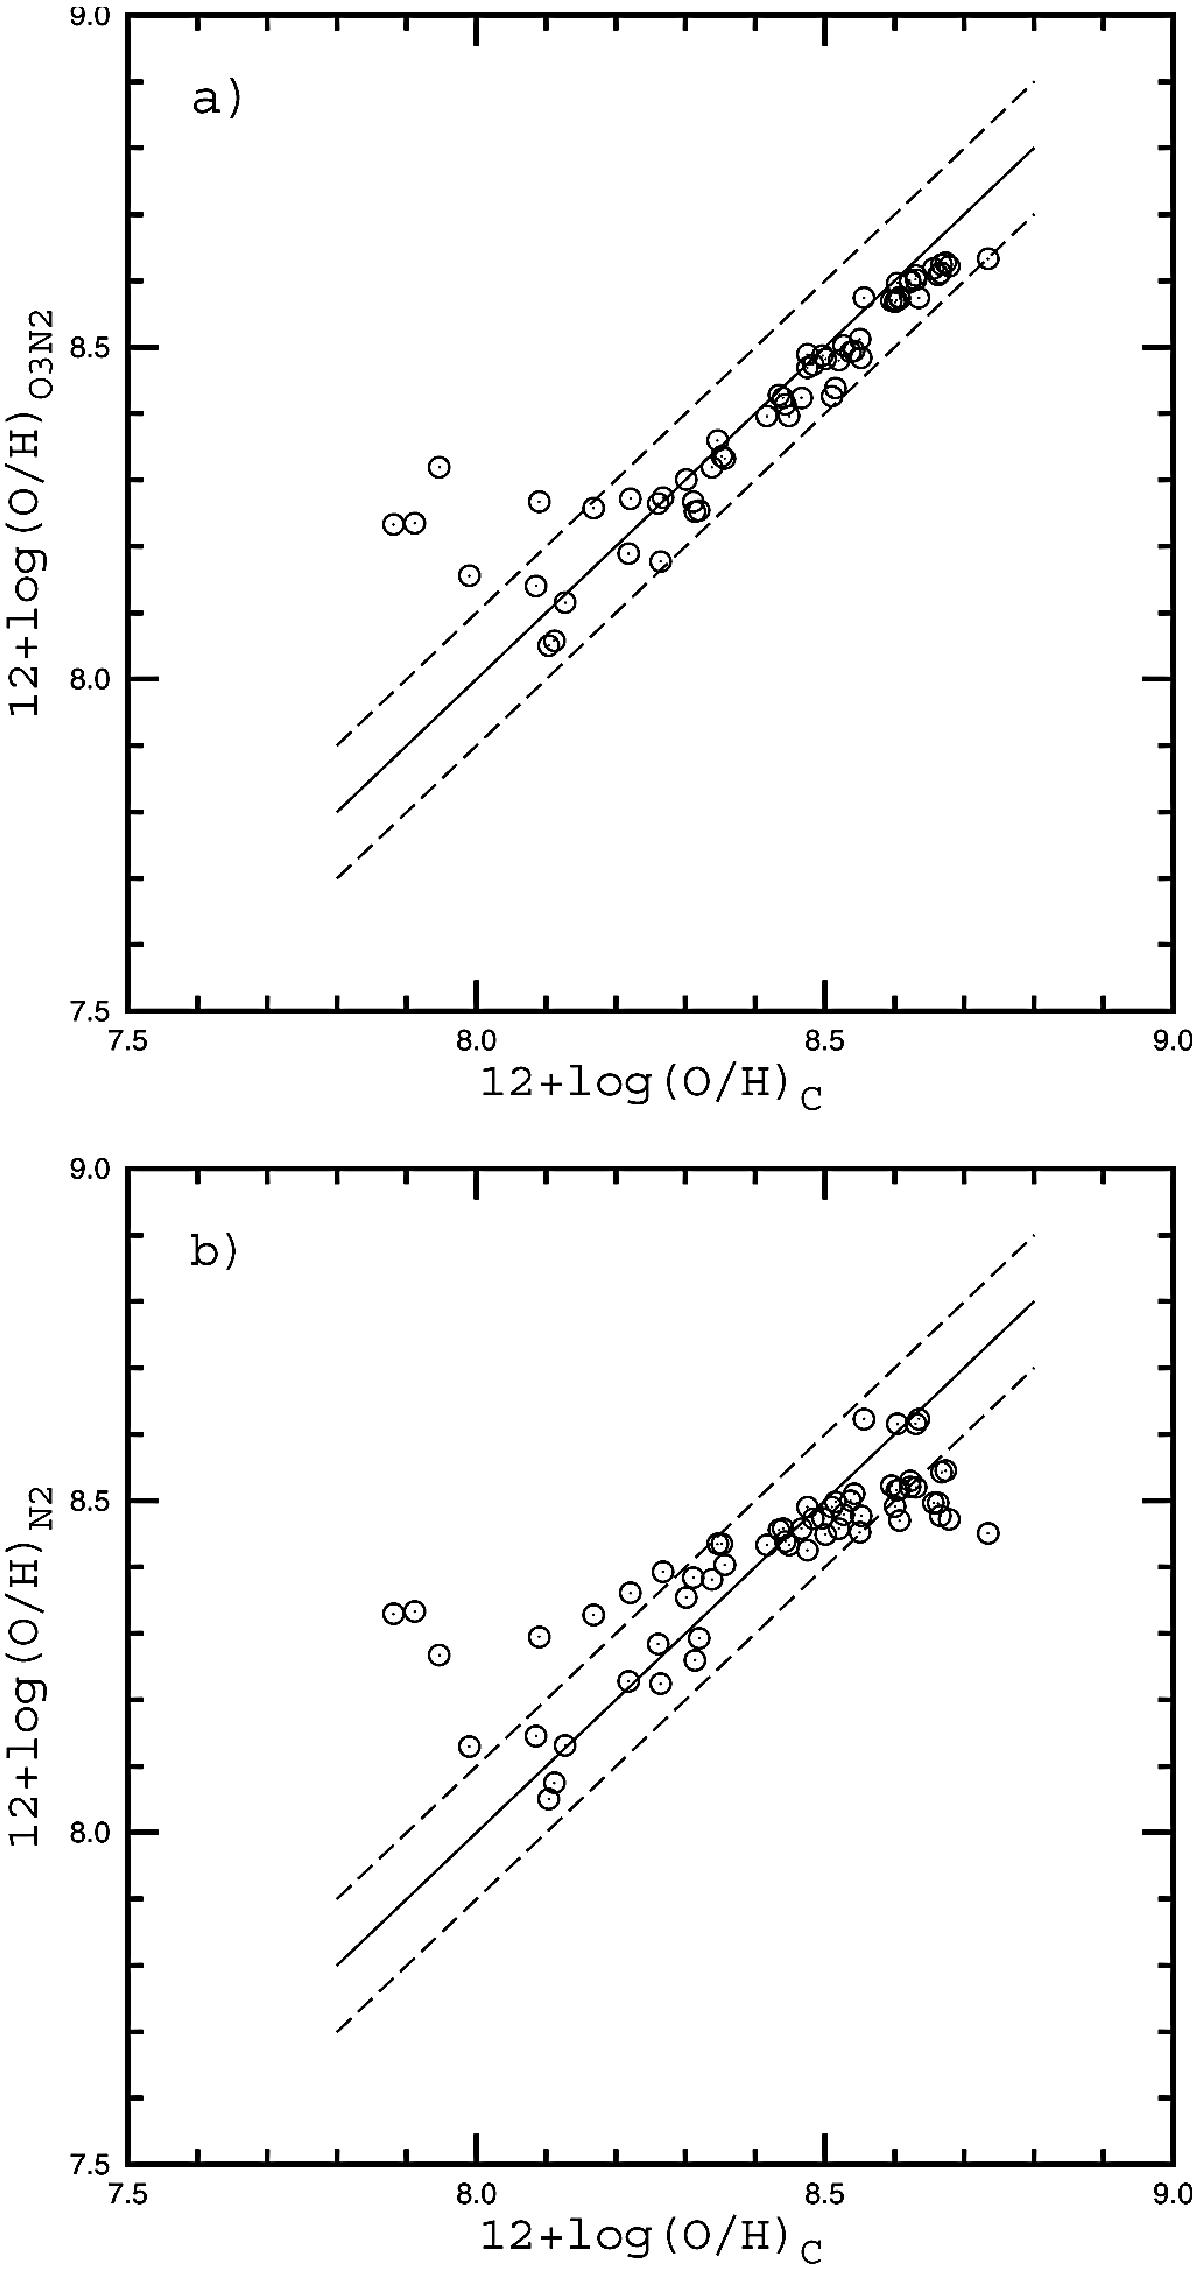
Comparison of the oxygen abundances in the individual H ii regions of our sample determined through the C method with oxygen abundances obtained through the O3N2 calibration (upper panel) and through the N2 calibration (lower panel). The solid line indicates a one-to-one correspondence. The dashed lines are shifted by ± 0.1 dex.
Current usage metrics show cumulative count of Article Views (full-text article views including HTML views, PDF and ePub downloads, according to the available data) and Abstracts Views on Vision4Press platform.
Data correspond to usage on the plateform after 2015. The current usage metrics is available 48-96 hours after online publication and is updated daily on week days.
Initial download of the metrics may take a while.