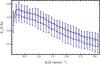
Fig. 8
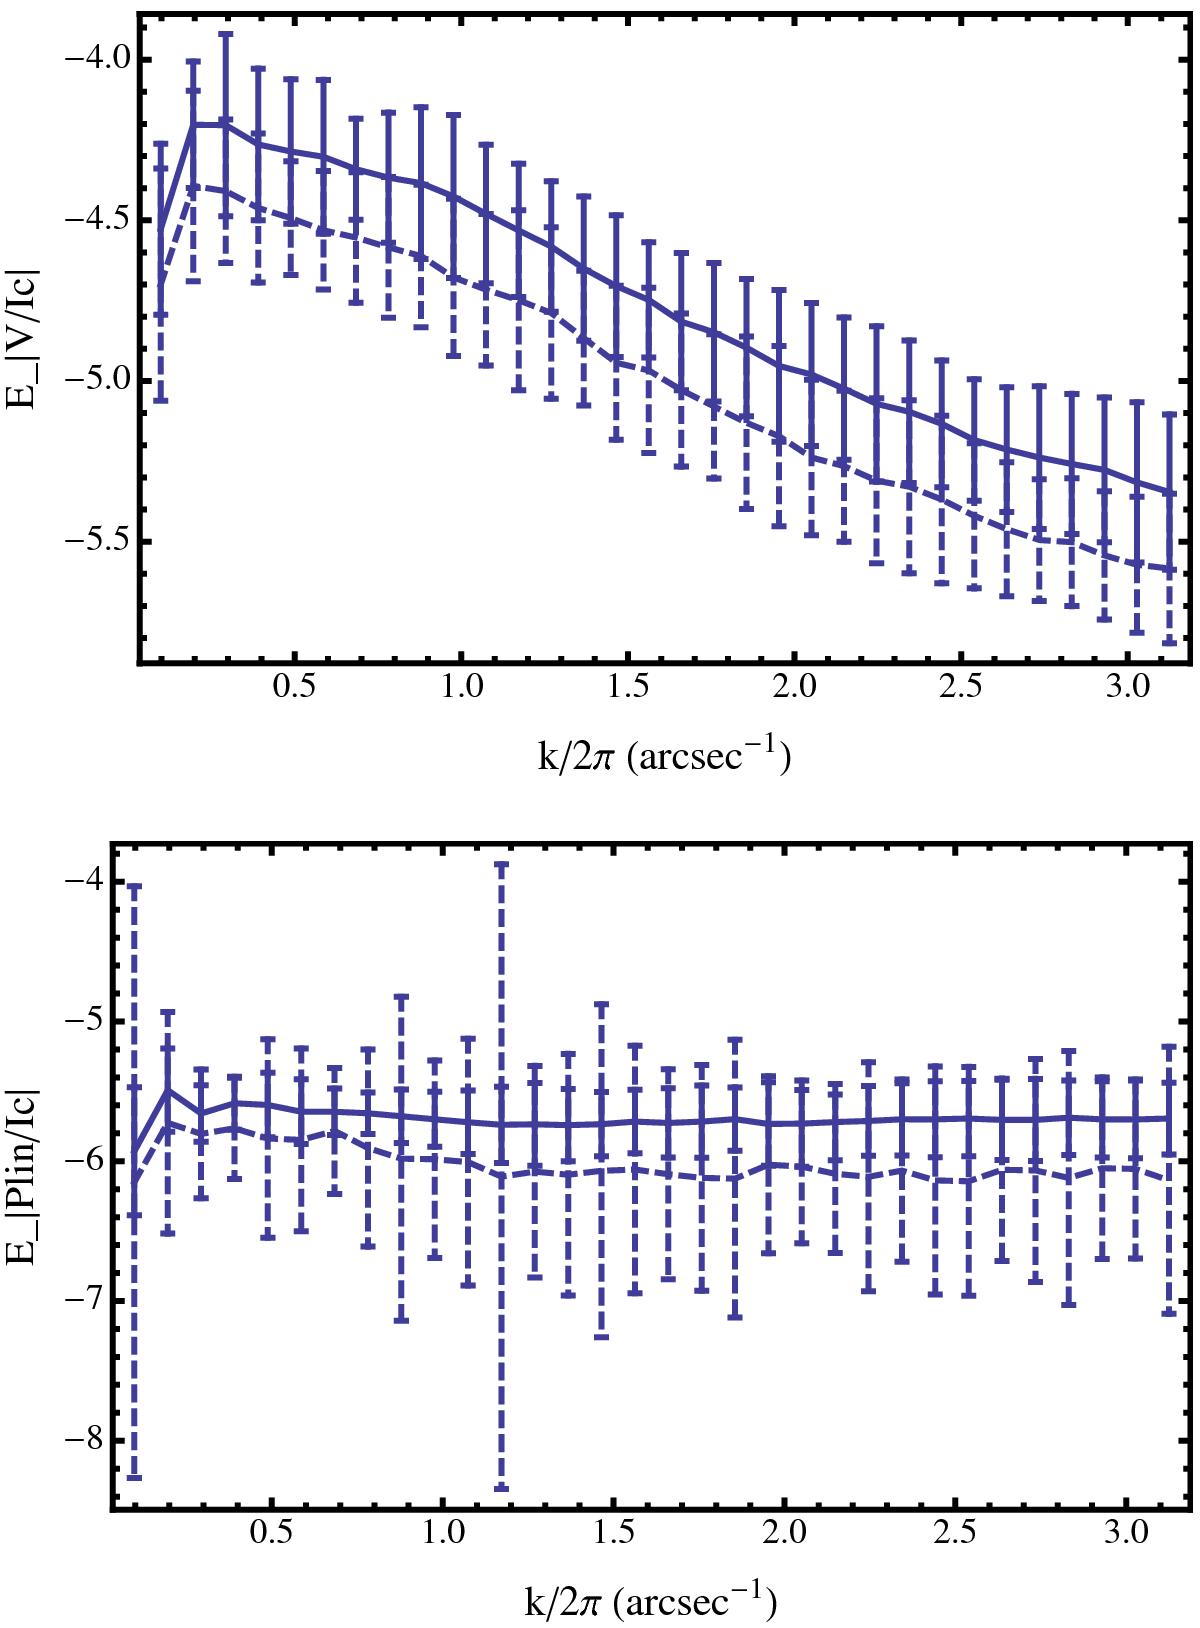
Power spectra of the polarization spatial fluctuations in the IN corrected for noise and defocus (see text) shown on log-lin scales. The errors bars show the standard deviations over the 98 IN images in our data sets. The full line represents the 2007 data, the dashed lines the 2013 data. The upper panel shows the unsigned circular polarization, the lower panel the linear polarization.
Current usage metrics show cumulative count of Article Views (full-text article views including HTML views, PDF and ePub downloads, according to the available data) and Abstracts Views on Vision4Press platform.
Data correspond to usage on the plateform after 2015. The current usage metrics is available 48-96 hours after online publication and is updated daily on week days.
Initial download of the metrics may take a while.