Fig. 7
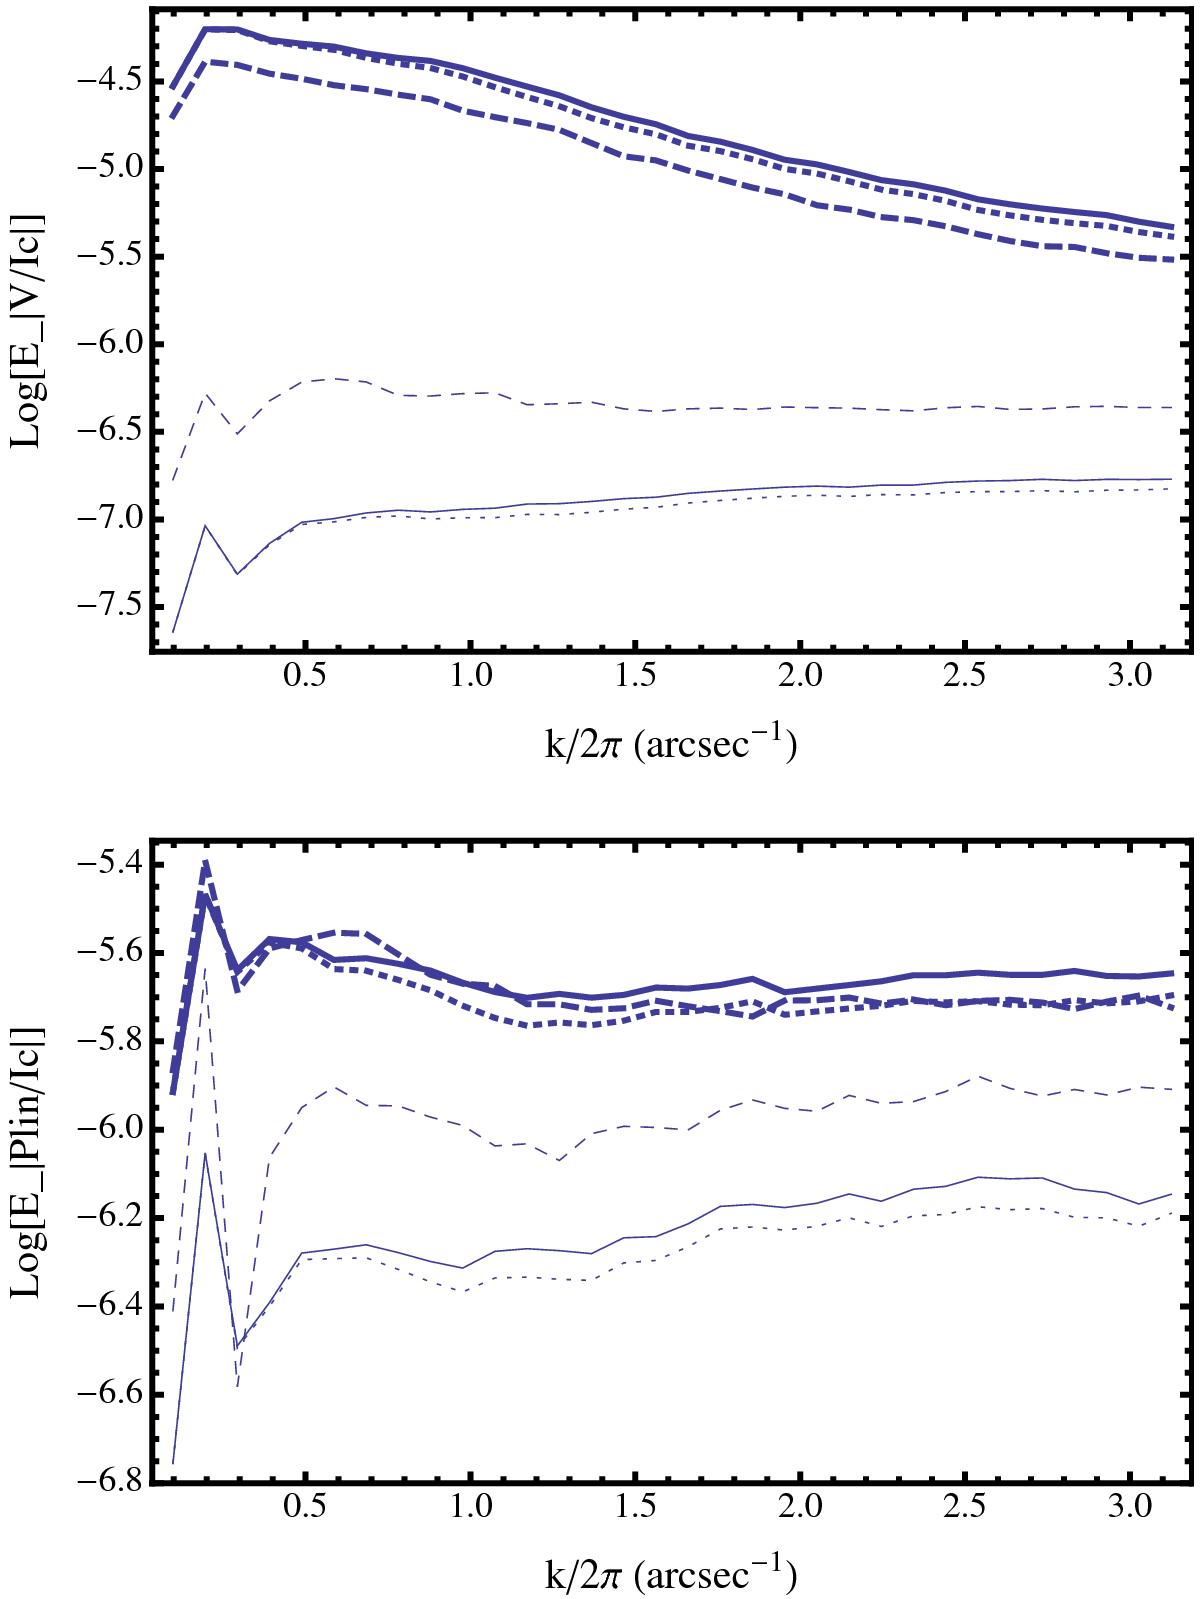
Power spectra of the polarization spatial fluctuations averaged over the 98 IN images in our data sets. The thick full line represents the 2007 data corrected for defocus, the thick dashed linethe 2013 data corrected for defocus, and the dark dotted line the 2007 data without defocus correction. The thin full line indicates the 2007 continuum corrected for defocus, the thin dashed line the 2013 continuum corrected for defocus, and the thin dotted line the 2007 continuum without defocus correction. The upper panel shows the unsigned circular polarization, the lower panel the linear polarization.
Current usage metrics show cumulative count of Article Views (full-text article views including HTML views, PDF and ePub downloads, according to the available data) and Abstracts Views on Vision4Press platform.
Data correspond to usage on the plateform after 2015. The current usage metrics is available 48-96 hours after online publication and is updated daily on week days.
Initial download of the metrics may take a while.