Fig. 5
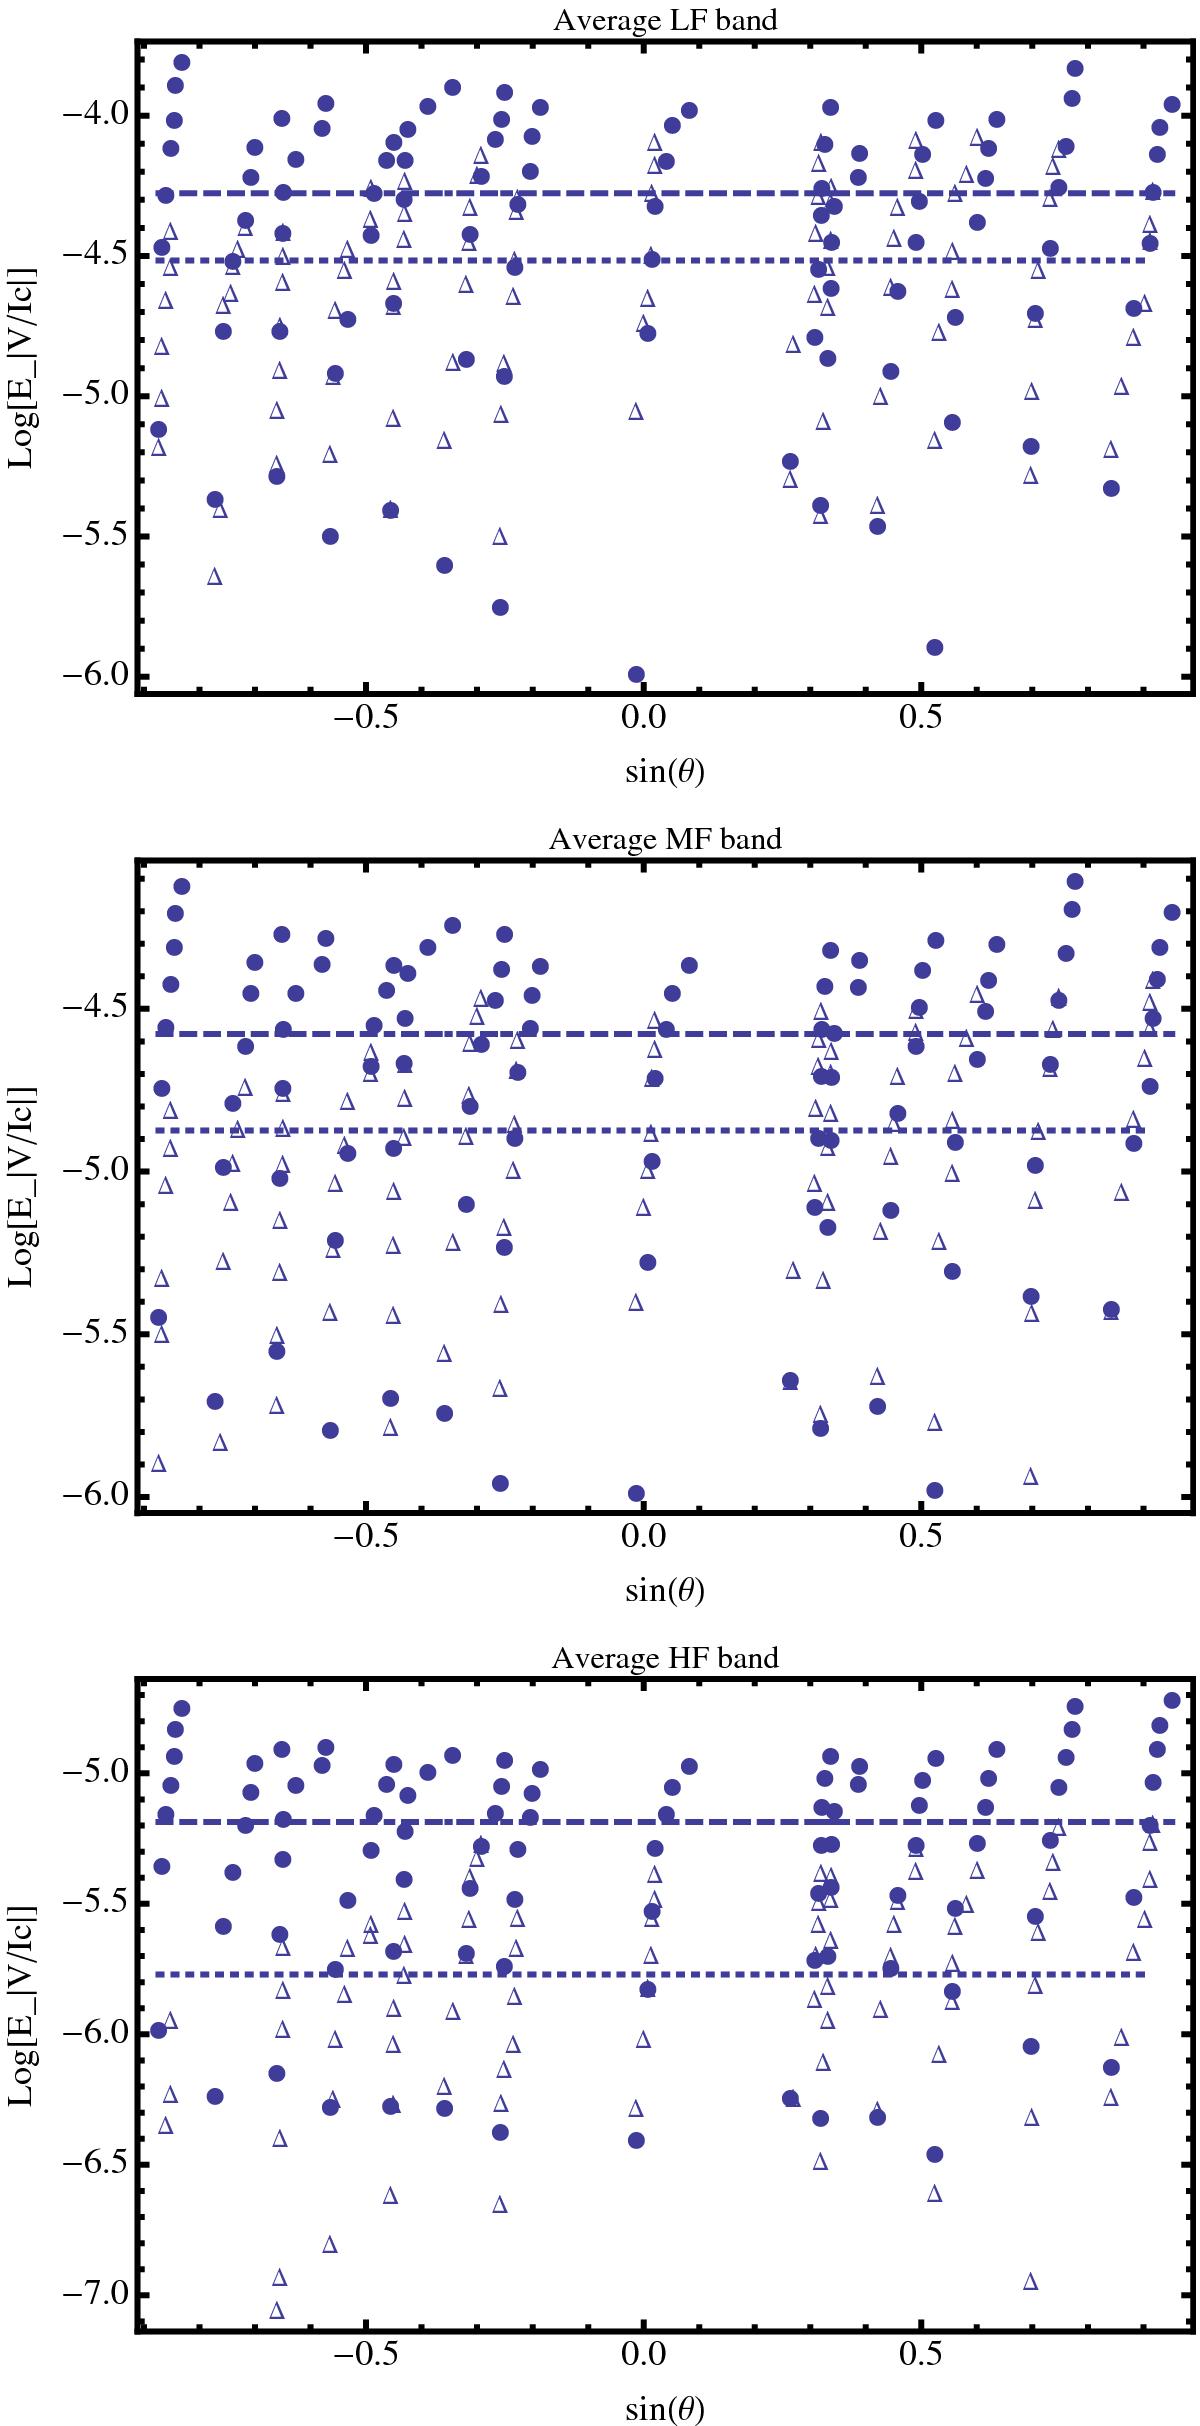
Average power of the unsigned circular polarization fluctuations in the 98 IN images for three spatial frequency bands on a Log scale. Circles represent the 2007 data set, triangles that of 2013. The dashed line indicates the average value in 2007, the dotted lines the average value in 2013. The upper panel shows the meso-granular scales, the middle panel the granular scales, and the lower panel the subgranular scales.
Current usage metrics show cumulative count of Article Views (full-text article views including HTML views, PDF and ePub downloads, according to the available data) and Abstracts Views on Vision4Press platform.
Data correspond to usage on the plateform after 2015. The current usage metrics is available 48-96 hours after online publication and is updated daily on week days.
Initial download of the metrics may take a while.