Free Access
Fig. 4
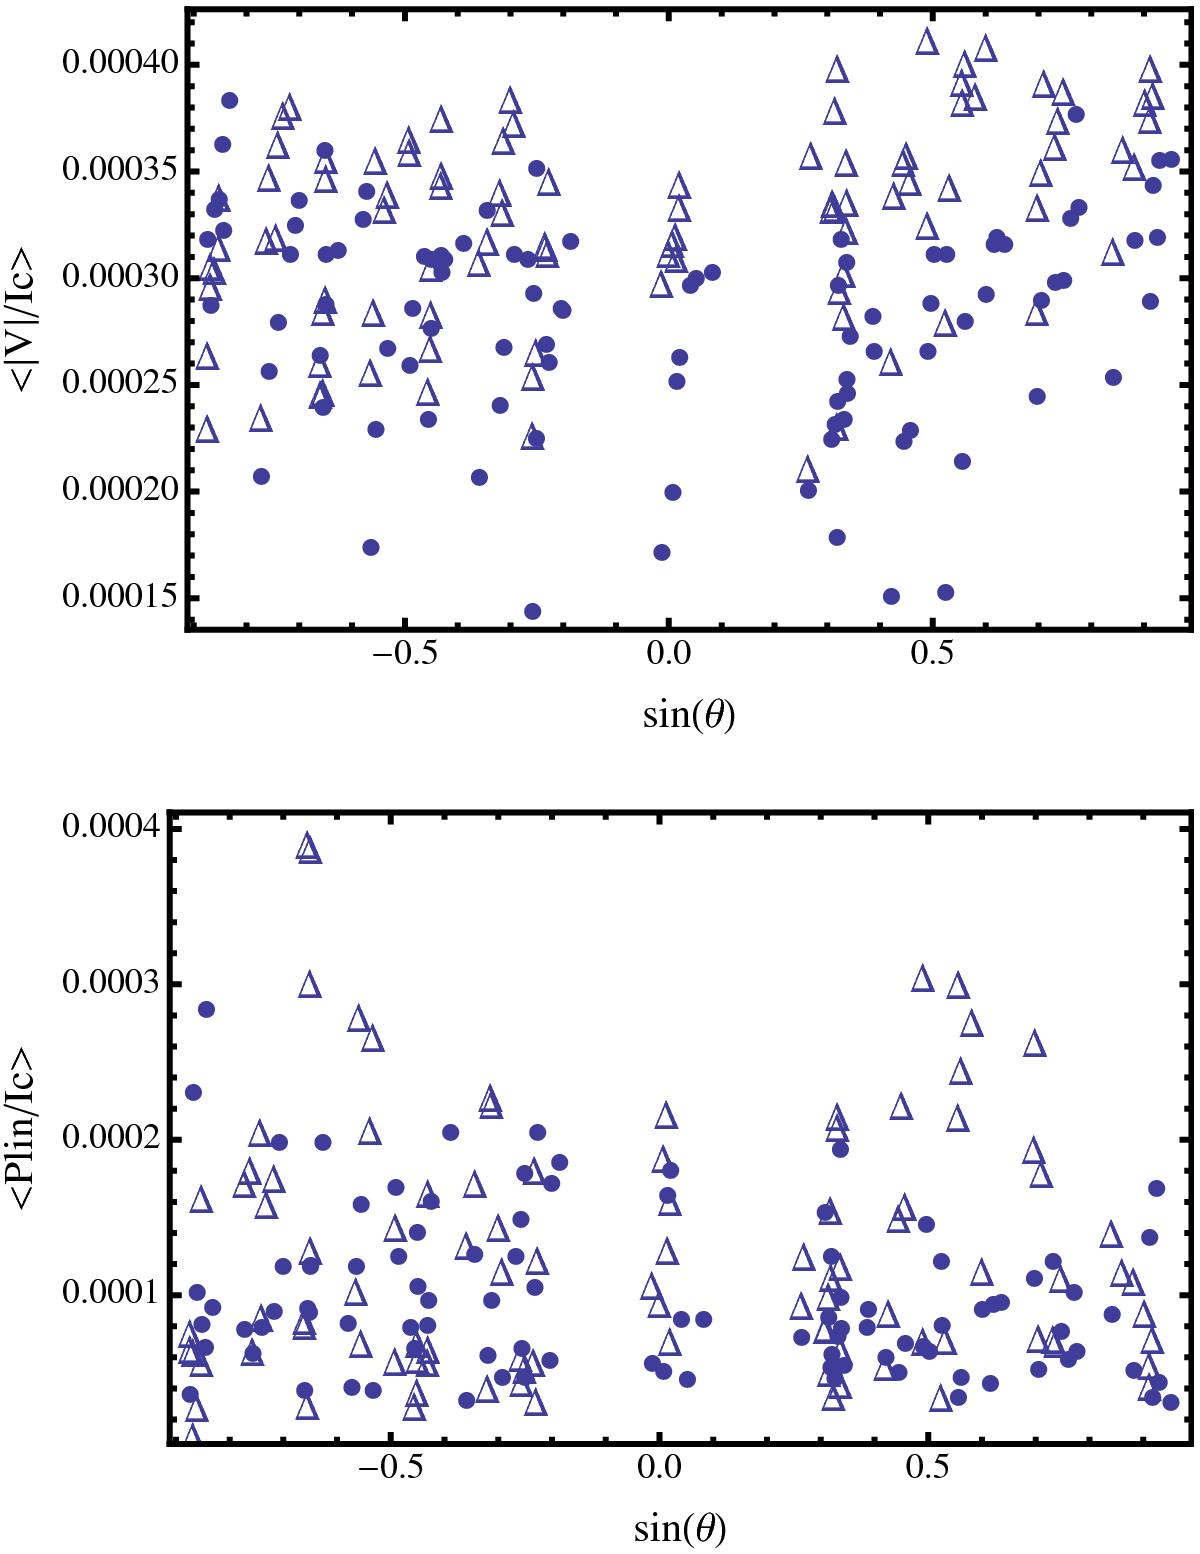
Mean value of the polarization in our 98 IN images. Triangles represent 2013 data, black circles the 2007 data. The upper panel shows the unsigned circular polarization, the lower panel the linear polarization after bias correction.
This figure is made of several images, please see below:
Current usage metrics show cumulative count of Article Views (full-text article views including HTML views, PDF and ePub downloads, according to the available data) and Abstracts Views on Vision4Press platform.
Data correspond to usage on the plateform after 2015. The current usage metrics is available 48-96 hours after online publication and is updated daily on week days.
Initial download of the metrics may take a while.