Fig. 3
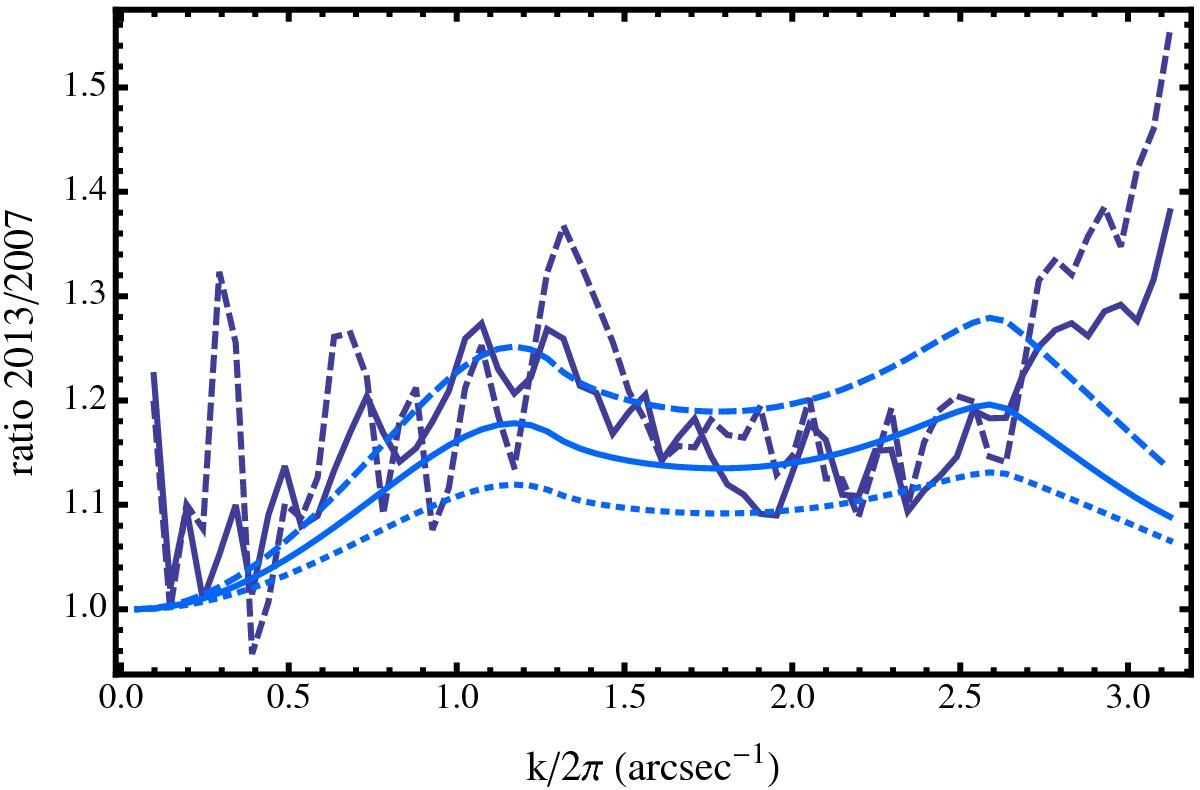
The thick full curve represents the standard radial average of the ratio of the continuum intensity power spectra at disk center in 2013 and 2007 data, the thick dashed curve the modified radial average. The thin curves indicate the modified radial average of MTF ratio for various defocus. The dashed line plots the relative phase default of 1.4π, the full line the relative phase default of 1.2π, and the dotted line the relative phase default of π.
Current usage metrics show cumulative count of Article Views (full-text article views including HTML views, PDF and ePub downloads, according to the available data) and Abstracts Views on Vision4Press platform.
Data correspond to usage on the plateform after 2015. The current usage metrics is available 48-96 hours after online publication and is updated daily on week days.
Initial download of the metrics may take a while.