Free Access
Fig. 2
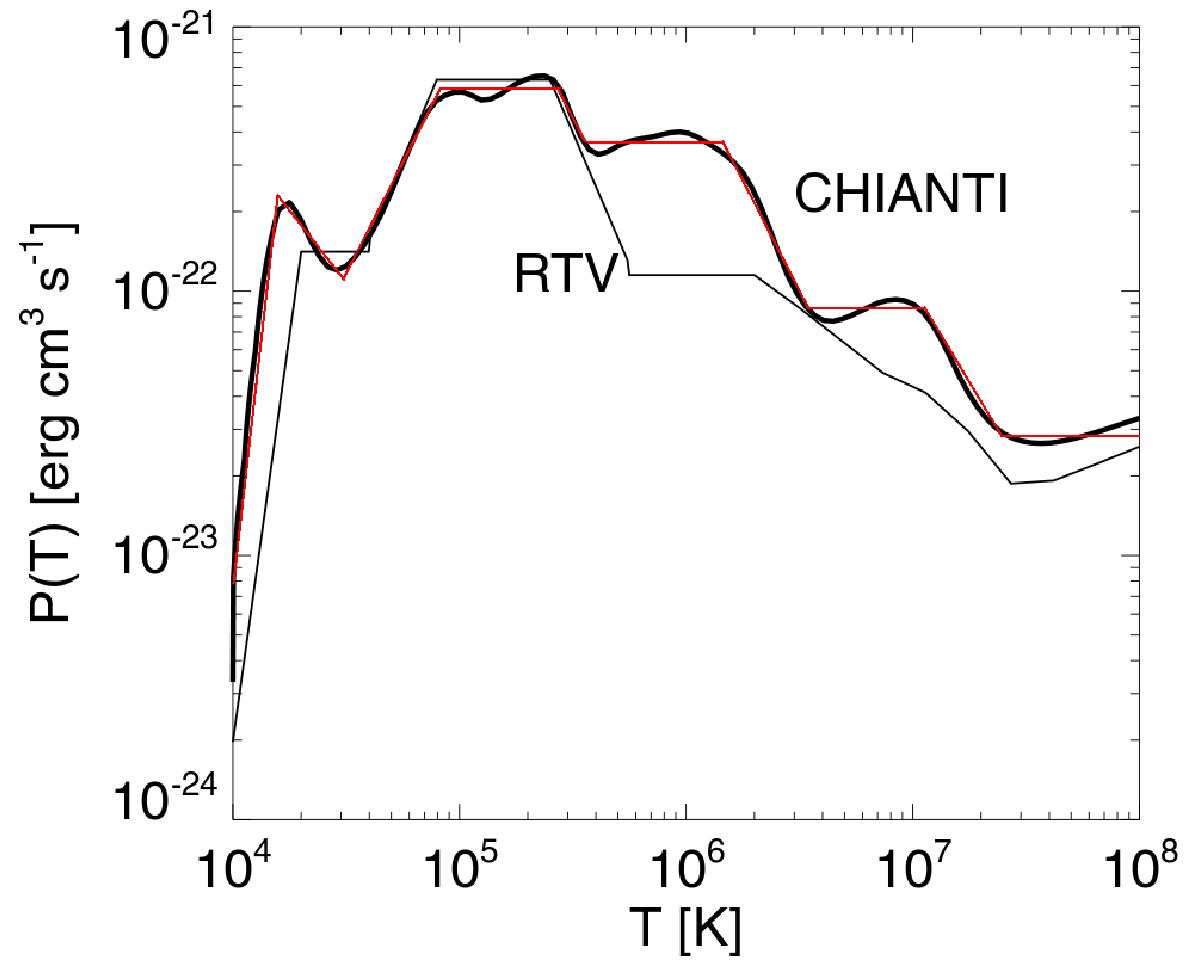
Plasma emissivity as a function of temperature, according to Rosner et al. (1978; thin solid line), and to version 7 of the CHIANTI spectral code Landi et al. (2012; thick solid line). The red line represents the piecewise emissivity used in our simulations. Adapted from Reale & Landi (2012).
Current usage metrics show cumulative count of Article Views (full-text article views including HTML views, PDF and ePub downloads, according to the available data) and Abstracts Views on Vision4Press platform.
Data correspond to usage on the plateform after 2015. The current usage metrics is available 48-96 hours after online publication and is updated daily on week days.
Initial download of the metrics may take a while.