Fig. 10
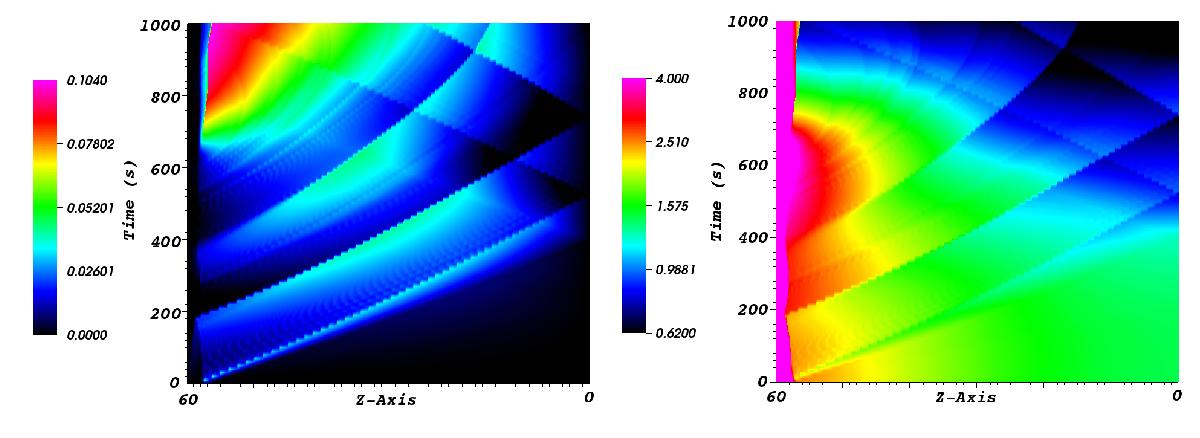
Time-slice plots showing the evolution of flow speed (vz, left) and the density (right) with included lower solar atmosphere, for the same conditions as in Fig. 8, along the loop axis, over time. The sawtooth appearance of wave fronts is due to the limited number of snapshots (100). Flow speed is in Mm/s, while density in units of 10-12 kg/m3.
Current usage metrics show cumulative count of Article Views (full-text article views including HTML views, PDF and ePub downloads, according to the available data) and Abstracts Views on Vision4Press platform.
Data correspond to usage on the plateform after 2015. The current usage metrics is available 48-96 hours after online publication and is updated daily on week days.
Initial download of the metrics may take a while.