Free Access
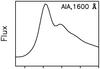
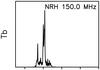
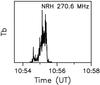
Fig. 7
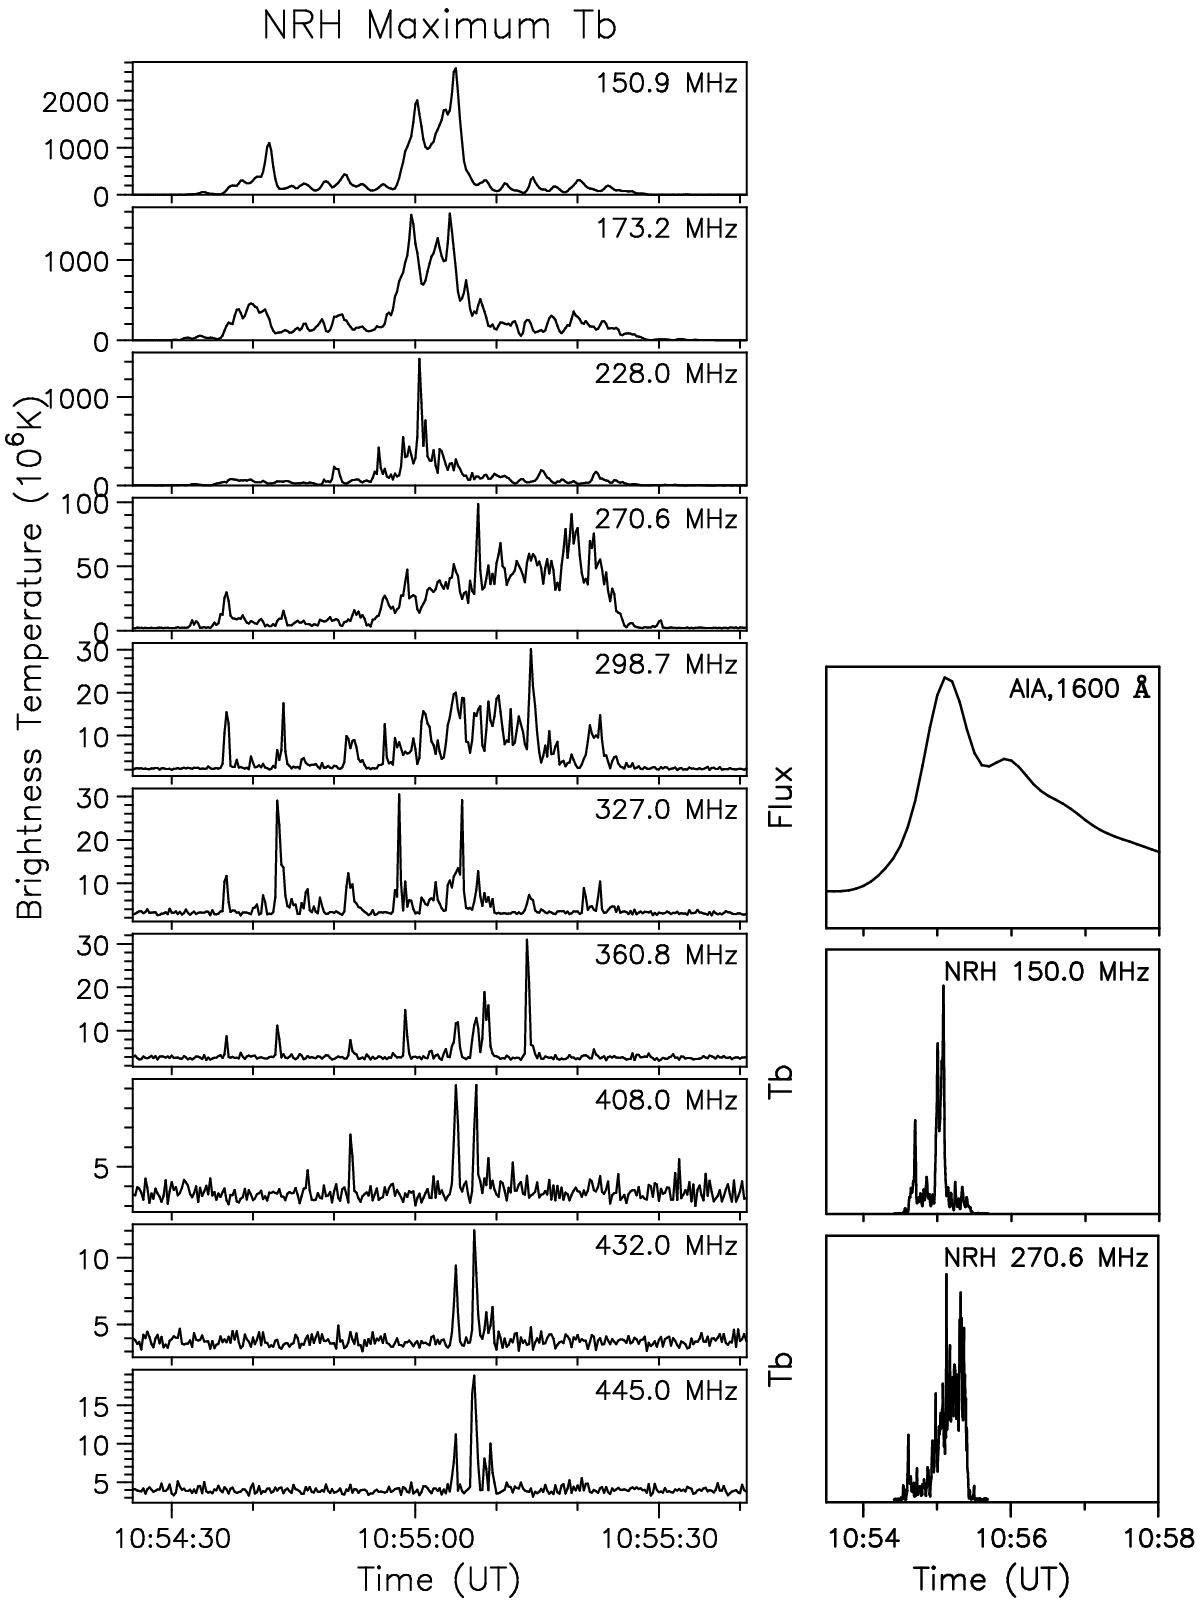
Maximum brightness temperature as a function of time; note that the scales are different for each frequency (left). Comparison of the 270.6 and 150 light curves with that of the 1600 Å AIA band (right).
This figure is made of several images, please see below:
Current usage metrics show cumulative count of Article Views (full-text article views including HTML views, PDF and ePub downloads, according to the available data) and Abstracts Views on Vision4Press platform.
Data correspond to usage on the plateform after 2015. The current usage metrics is available 48-96 hours after online publication and is updated daily on week days.
Initial download of the metrics may take a while.