Fig. 5
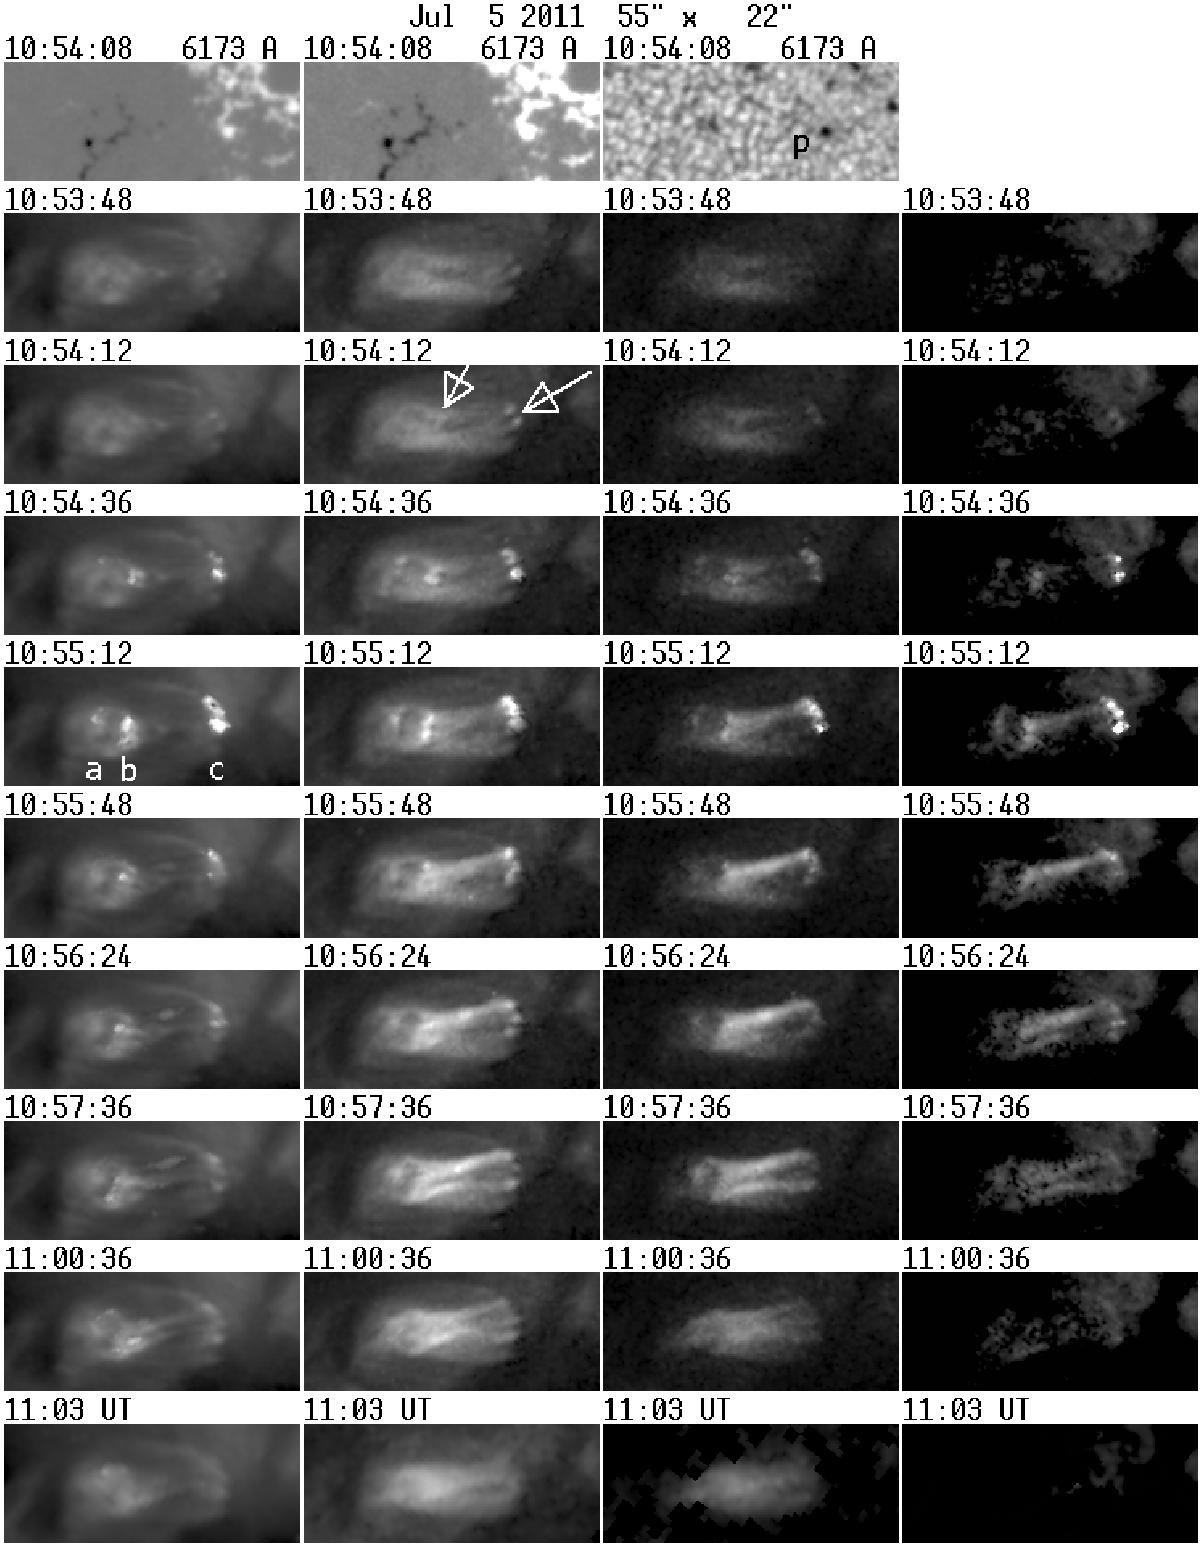
Selected images of the DEM in the temperature ranges 1−2 × 10⁶ K (first column, maximum value 2.5 × 1028 cm-5), 2−4 × 10⁶ K (second column, maximum value 3.0 × 1028 cm-5), 4−8 × 10⁶ K (third column, maximum value 2.0 × 1028 cm-5) and above 8 × 10⁶ K (right column, maximum value 2.0 × 1028 cm-5) in the course of event B. The contrast of the display (0.6 for the first column and 0.4 for the others) was adjusted for best viewing. The top row shows HMI magnetograms (full range and saturated at ± 300 G) and a while-light image. The arrows in the 10:54:12 UT image mark the first brightenings, a, b and c in the 10:55:12 UT image mark three sets of footpoints; p in the white-light image marks a small pore. The field of view is 55 by 22′′ and the images have been rotated for easier viewing. A movie available online shows the full time sequence of DEM images (top row of movie) as well as DEM difference images (bottom row of the movie).
Current usage metrics show cumulative count of Article Views (full-text article views including HTML views, PDF and ePub downloads, according to the available data) and Abstracts Views on Vision4Press platform.
Data correspond to usage on the plateform after 2015. The current usage metrics is available 48-96 hours after online publication and is updated daily on week days.
Initial download of the metrics may take a while.