Fig. 2
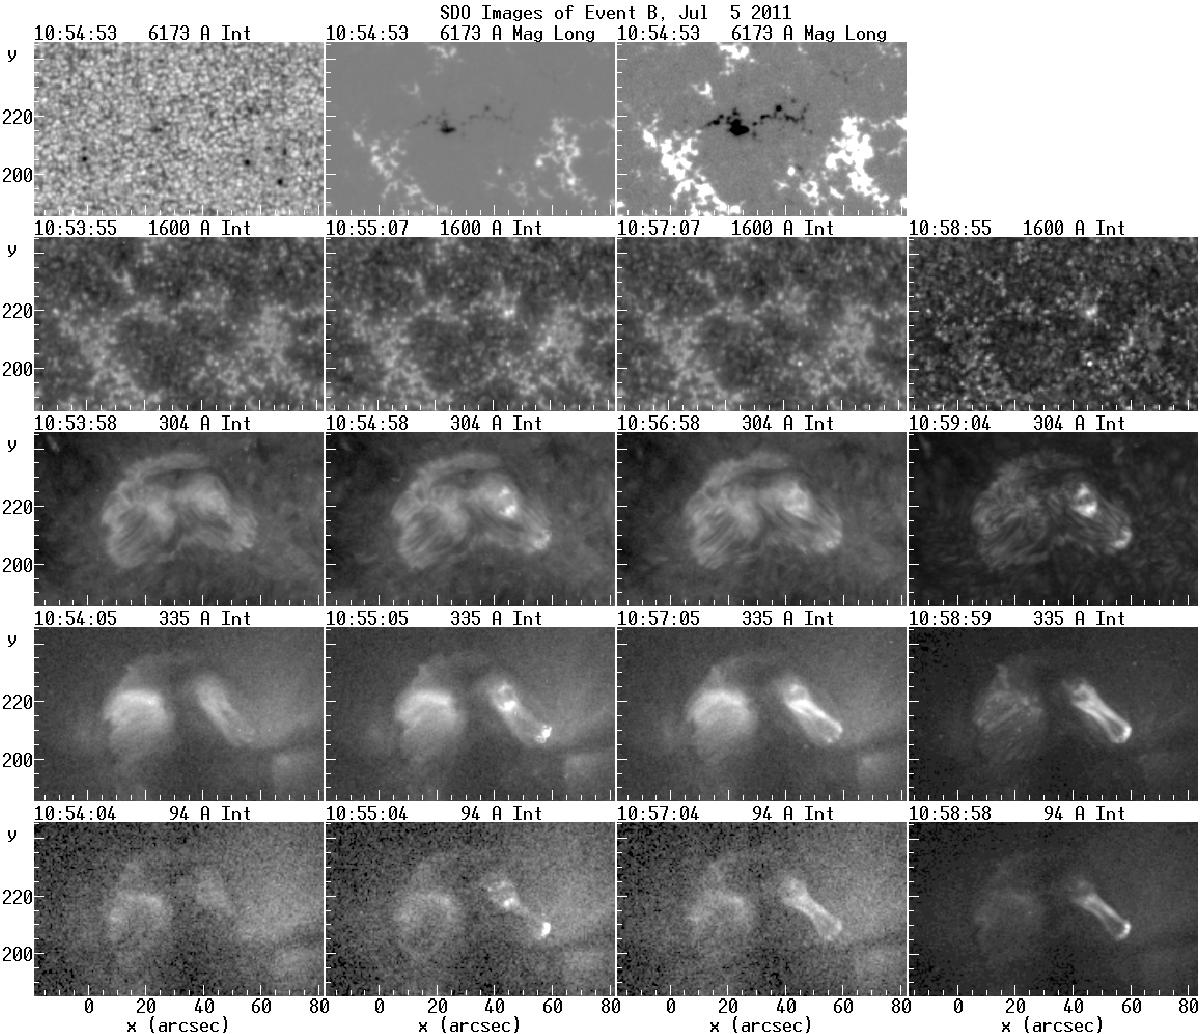
SDO images of the flaring loop associated with event B. The top row shows an HMI white-light image with the corresponding magnetogram shown both with the full intensity range (± 975 G) and saturated at ± 200 G. The other rows show AIA images in the 1600, 304, 335 and 94 Å bands. The right-most column gives the RMS of the intensity during the event at the corresponding band. In this and all figures, the contrast for each wavelength band has been adjusted for best viewing.
Current usage metrics show cumulative count of Article Views (full-text article views including HTML views, PDF and ePub downloads, according to the available data) and Abstracts Views on Vision4Press platform.
Data correspond to usage on the plateform after 2015. The current usage metrics is available 48-96 hours after online publication and is updated daily on week days.
Initial download of the metrics may take a while.