Free Access
Fig. 11
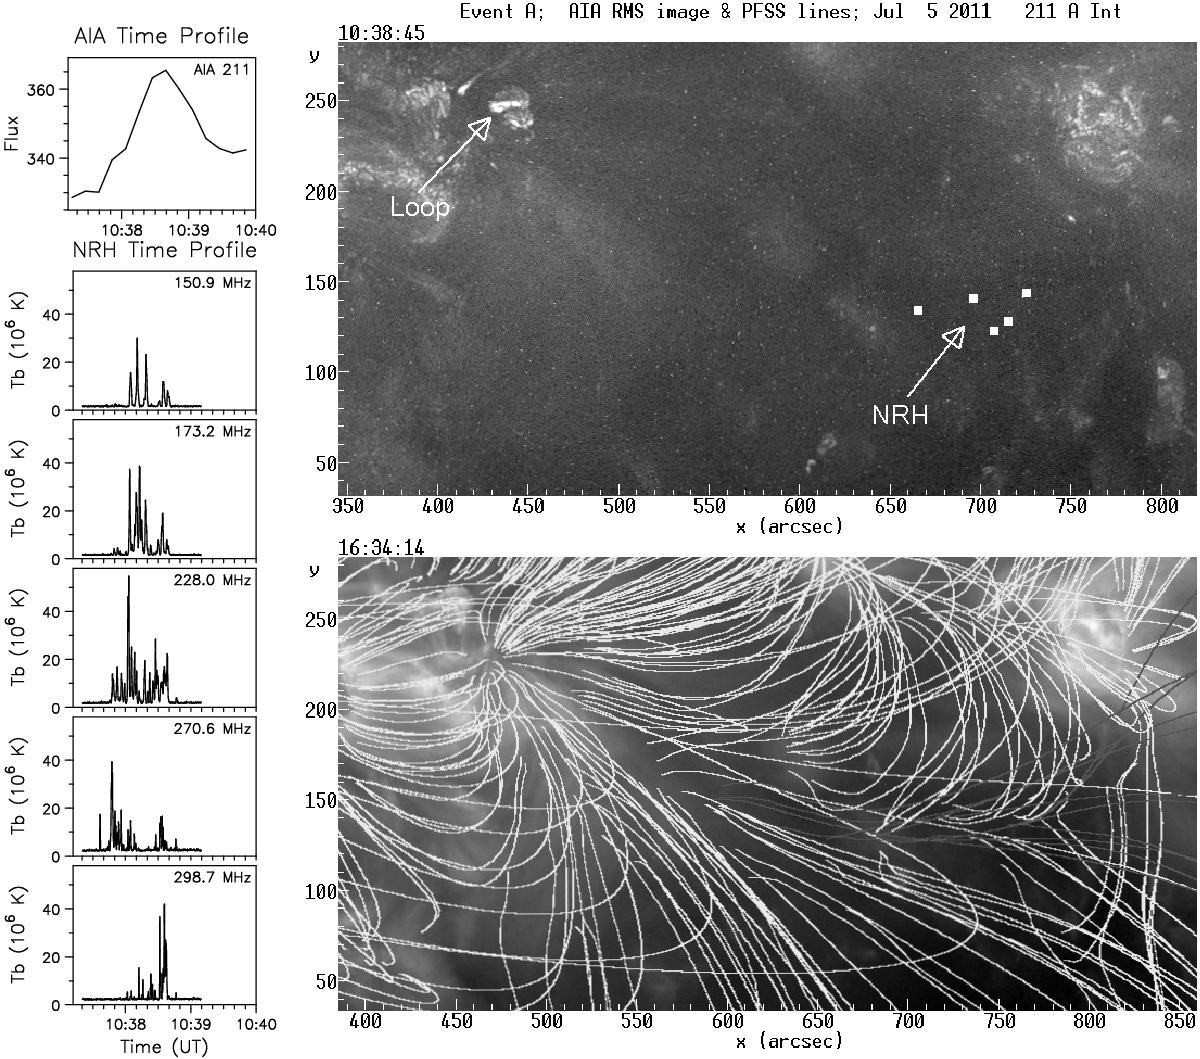
Left: AIA and NRH time profiles of event A. Top right panel: image of the intensity RMS in the 211 Å band; white squares mark the position of the NRH sources at (from E to W) 270.6, 298.7, 150.9, 173.2 and 228 MHz. Right, bottom: PFSS magnetic lines of force4.
This figure is made of several images, please see below:
Current usage metrics show cumulative count of Article Views (full-text article views including HTML views, PDF and ePub downloads, according to the available data) and Abstracts Views on Vision4Press platform.
Data correspond to usage on the plateform after 2015. The current usage metrics is available 48-96 hours after online publication and is updated daily on week days.
Initial download of the metrics may take a while.