Free Access
Fig. 10
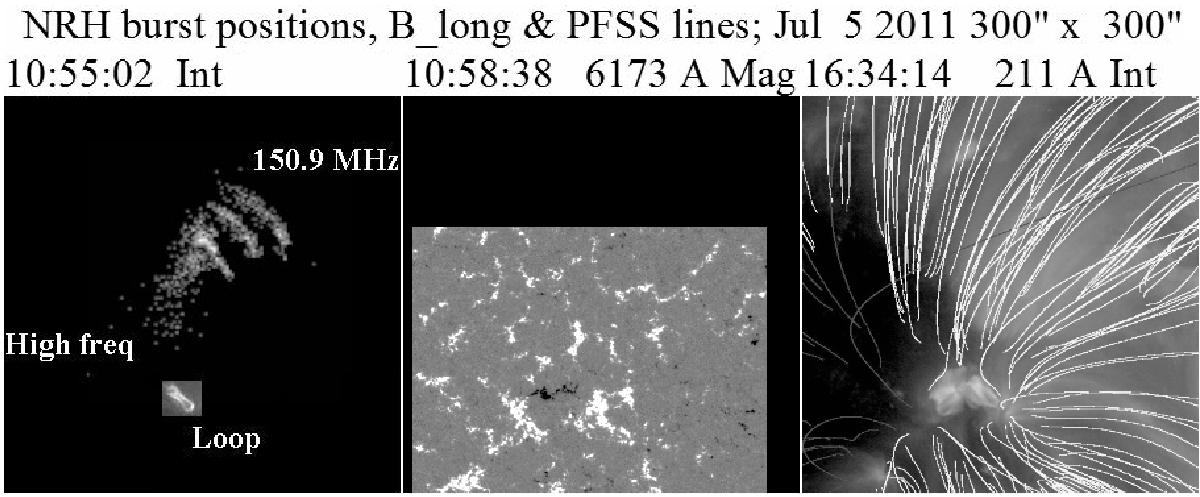
From left to right: combined 2D histograms of the position of NRH sources at all frequencies; the inset shows an image of the loop at 335 Å; HMI/SDO magnetogram; lines of force of the potential magnetic field extrapolation superimposed on a 211 Å AIA image3.
Current usage metrics show cumulative count of Article Views (full-text article views including HTML views, PDF and ePub downloads, according to the available data) and Abstracts Views on Vision4Press platform.
Data correspond to usage on the plateform after 2015. The current usage metrics is available 48-96 hours after online publication and is updated daily on week days.
Initial download of the metrics may take a while.