Fig. 6
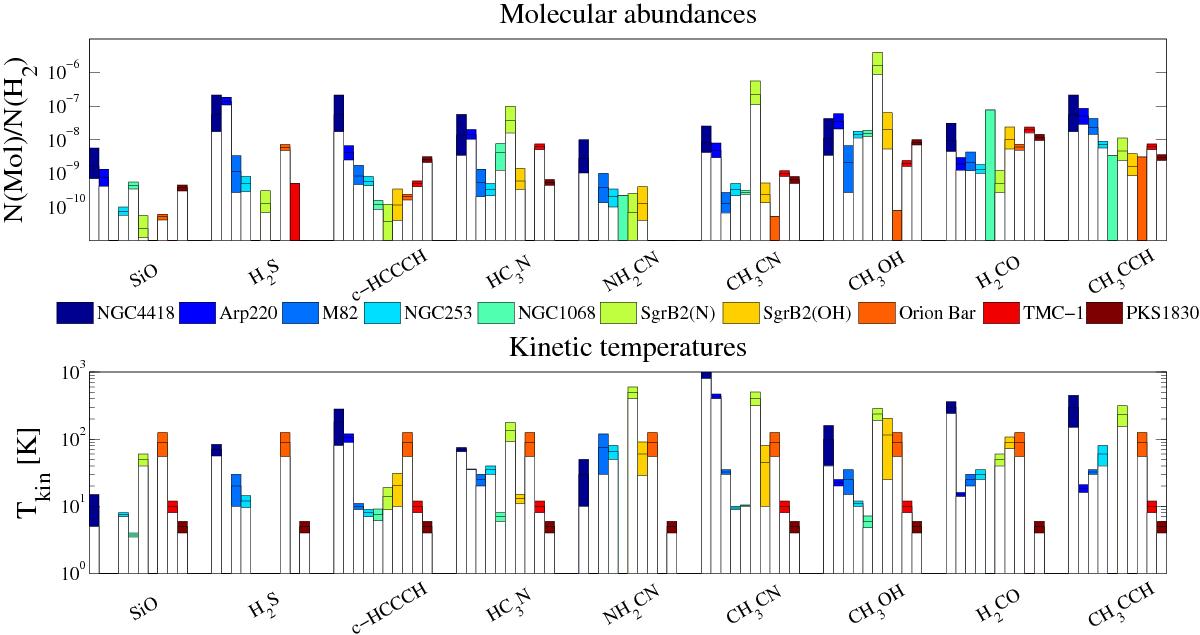
Molecular abundances and kinetic temperatures for Galactic and extragalactic objects. Data for Sgr B2(N), Sgr B2(OH), the Orion Bar, TMC-1, M 82, and NGC 253 were taken from Martín et al. (2006), and references therein. Data for Arp 220, NGC 1068, and PKS 1830-211 come from spectral scans, respectively by Martín et al. (2011), Aladro et al. (2013), and Muller et al. (2011). The color bars represent 1σ confidence intervals. In case no confidence interval was reported in the literature, a 20% uncertainty was assumed. Filled bars represent upper limits. Abundances are reported in Table A.2.
Current usage metrics show cumulative count of Article Views (full-text article views including HTML views, PDF and ePub downloads, according to the available data) and Abstracts Views on Vision4Press platform.
Data correspond to usage on the plateform after 2015. The current usage metrics is available 48-96 hours after online publication and is updated daily on week days.
Initial download of the metrics may take a while.