Fig. 3
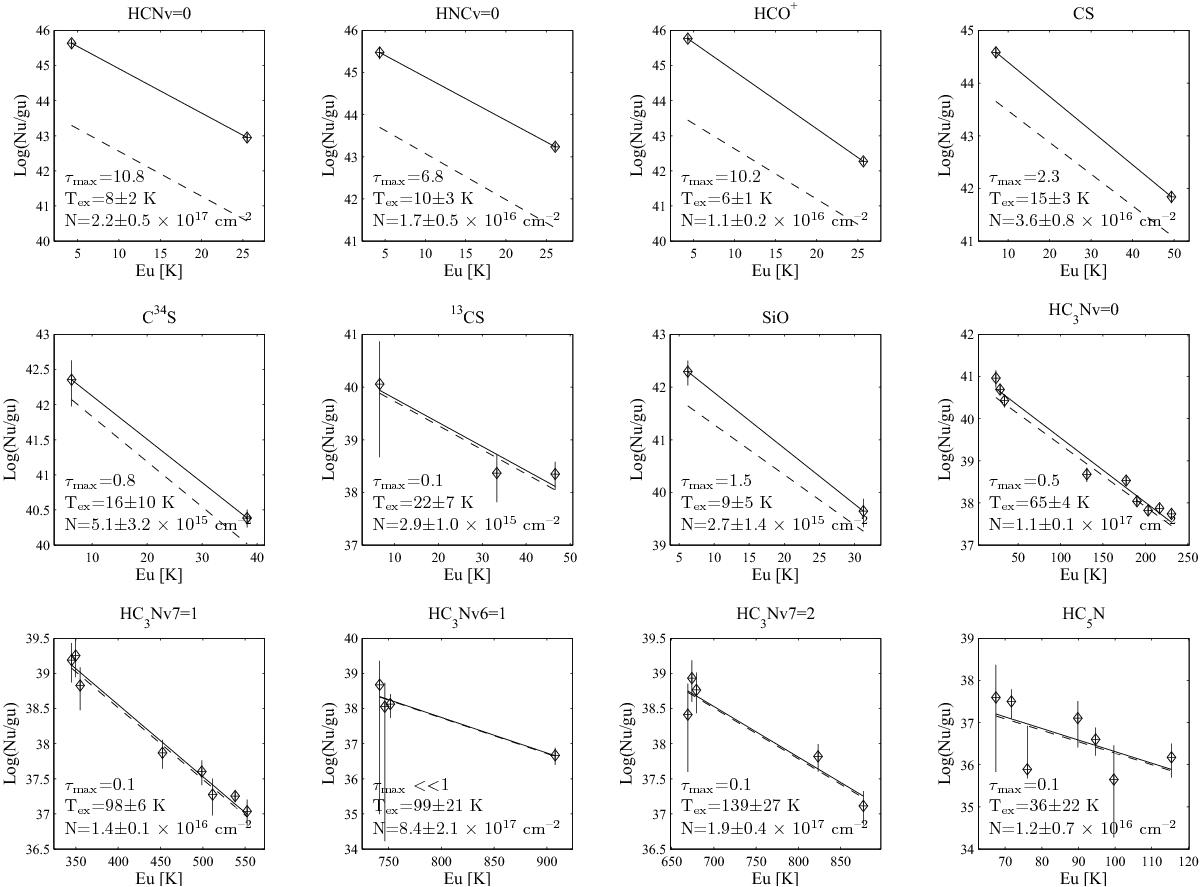
Population diagrams for molecules with non-blended emission lines. The diamonds represent the values of Nu/gu for each transition, derived applying the opacity correction. The solid line shows the fit to the opacity-corrected data, while the dashed line shows the fit assuming optically thin emission. The fitted values for column density (N) and excitation temperature (Tex) are reported, together with the maximum opacity of the observed transitions. The error bars show 3σ uncertainties.
Current usage metrics show cumulative count of Article Views (full-text article views including HTML views, PDF and ePub downloads, according to the available data) and Abstracts Views on Vision4Press platform.
Data correspond to usage on the plateform after 2015. The current usage metrics is available 48-96 hours after online publication and is updated daily on week days.
Initial download of the metrics may take a while.